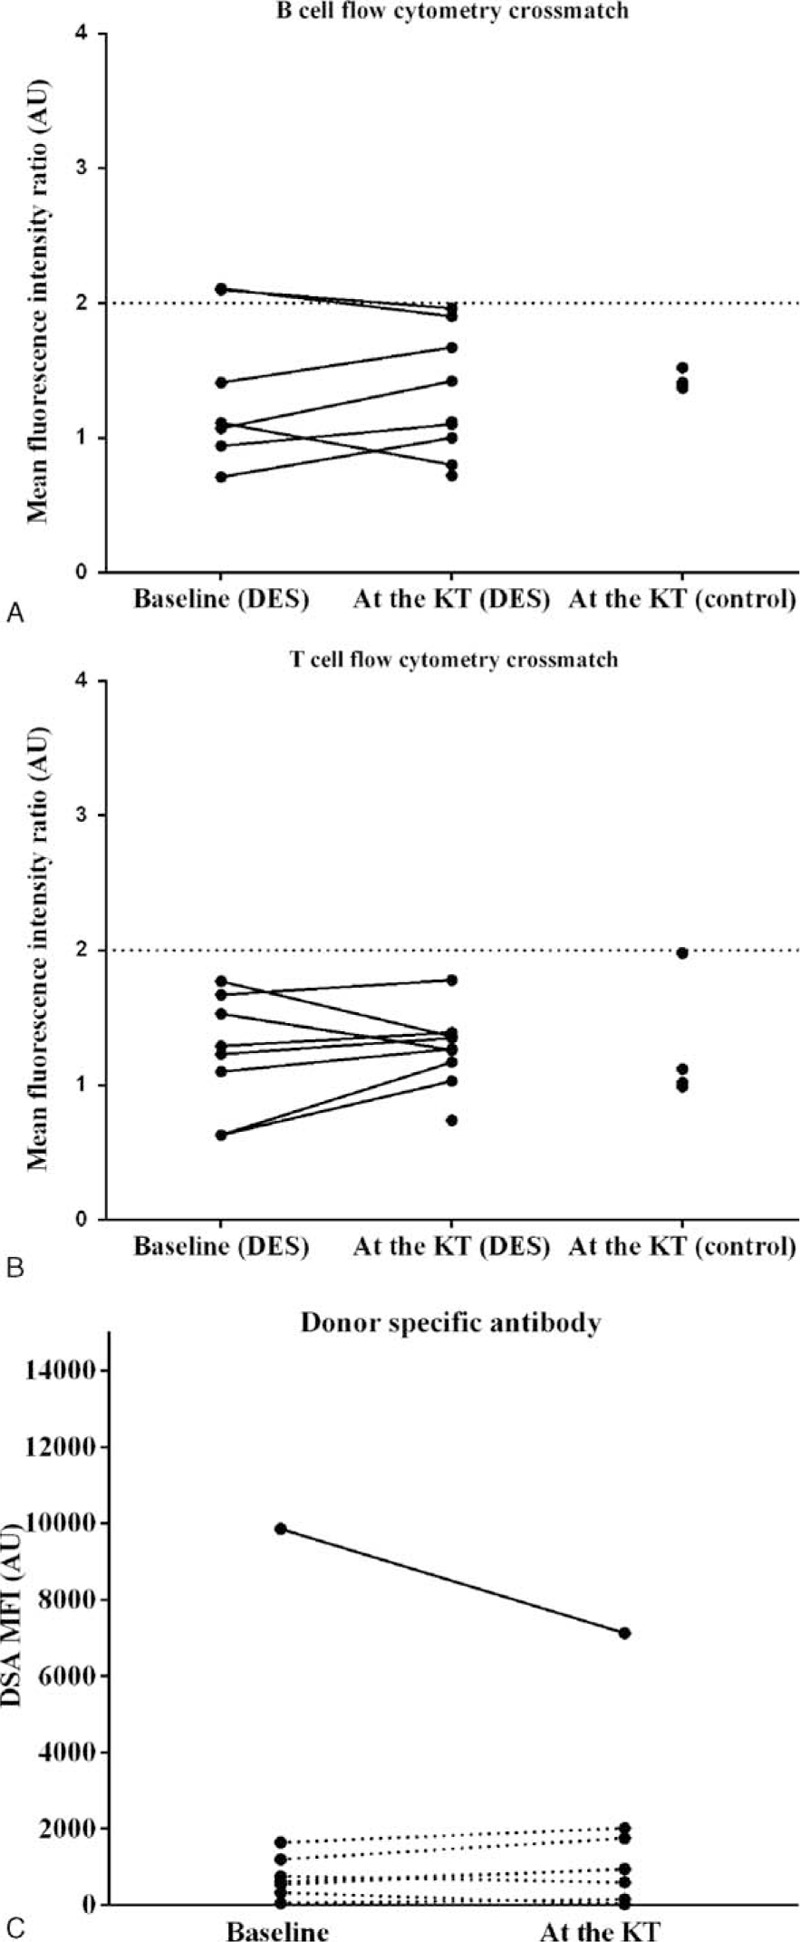
FIGURE 5.

Changes in intensity of flow cytometry crossmatch results (A-B) and levels of DSA (C) after desensitization. The positivity of flow cytometry crossmatch results were interpreted based on the MFI ratio. Each horizontal line of graph (A) and (B) indicates the cutoff value for the B- and T-cell flow cytometry crossmatch, respectively. In graph (C), each dot represents the summation of donor-specific antibodies. Solid line represents the case whose baseline DSA value was above 2000 MFI. Dashed line represents the cases whose baseline DSA values were below 2000 MFI. Desensitization reduced DSA level only in 1 case where baseline DSA was above 2000 MFI. AU = arbitrary unit, DES = desensitization, DSA = donor-specific antibody, KT = kidney transplantation, MFI = mean fluorescence intensity.
