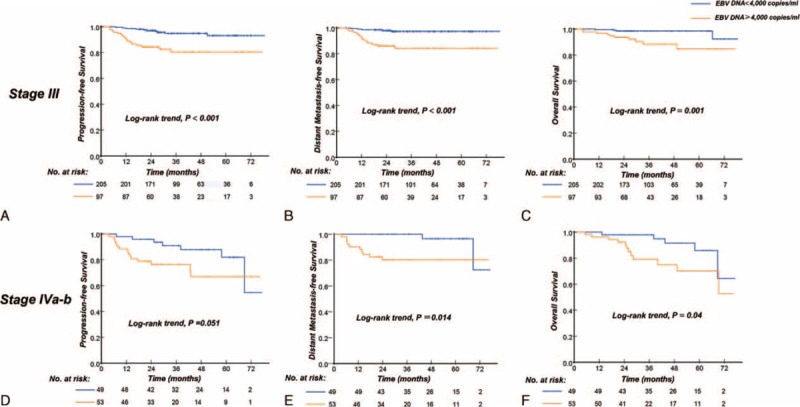
FIGURE 3.

Kaplan–Meier curves of progression-free survival and distant metastasis-free survival according to the pretreatment EBV DNA levels (<4000 copies/mL vs ≥4000 copies/mL) for subgroup analysis. Progression-free survival (A), distant metastasis-free survival (B), and overall survival (C) for patients staged III; progression-free survival (D), distant metastasis-free survival (E), and overall survival (F) for patients staged IVa-b. EBV DNA = Epstein–Barr Virus DNA.
