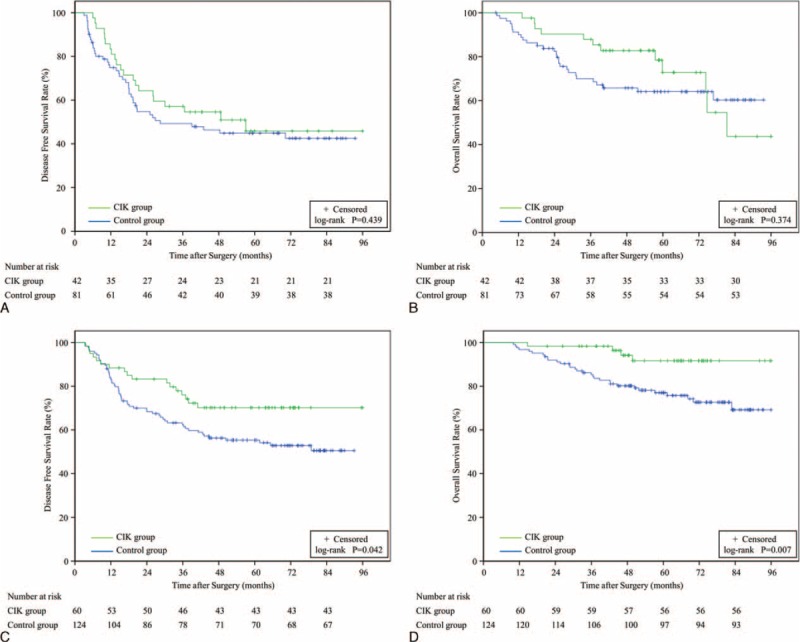
FIGURE 3.

DFS and OS Kaplan-Meier analysis of solitary HCC patients treated with curative resection and CIK therapy (CIK group) or curative resection alone (control group) and further grouped by MVI status. The survival of MVI-positive patients in the CIK group (n = 42) and the control group (n = 81) was analyzed according to (A) DFS curves (P = 0.439), or (B) OS curves (P = 0.374). The survival of MVI-negative patients in the CIK group (n = 60) and the control group (n = 124) was analyzed according to (C) DFS curves (P = 0.042), or (D) OS curves (P = 0.007). CIK = cytokine-induced killer, DFS = disease-free survival, HCC = hepatocellular carcinoma, MVI = microvascular invasion, OS = overall survival.
