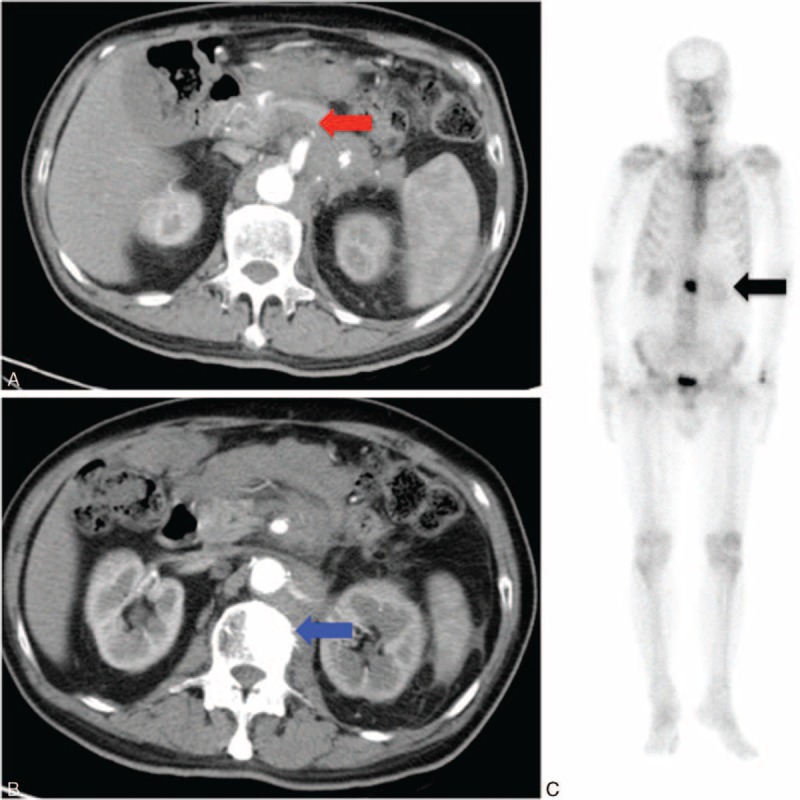
FIGURE 3.

(A) Abdominal CT with contrast showing an ill-defined mass in the pancreatic body. Tumor involves the celiac axis and the superior mesenteric artery, with some enlarged lymph nodes at the paraaortic region (red arrow); (B) the CT showed a hyperdensity lesion at L2 vertebral body (blue arrow); and (C) the bone scan shows abnormal uptaking in about the L2 level (black arrow). Bone metastasis was suspected. CT = computed tomography.
