
FIGURE 1.
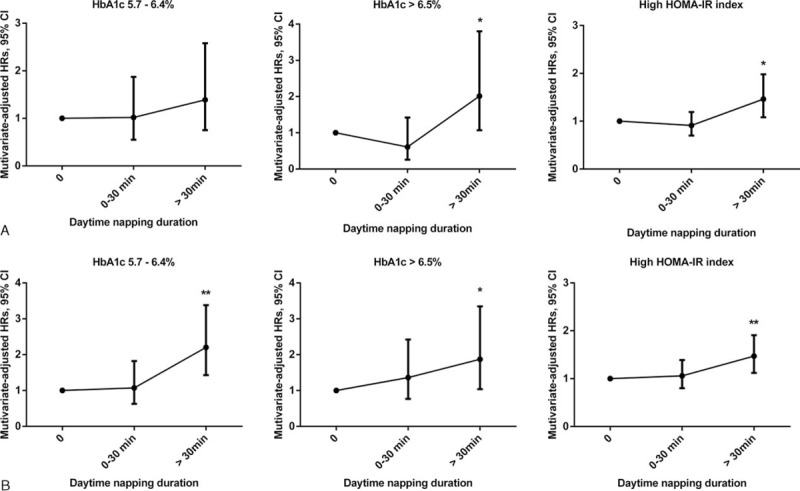
Hazard ratios (HRs) and 95% confidence intervals (CIs) for elevated glycosylated hemoglobin (HbA1c) levels and high HOMA-IR (homeostasis model assessment of insulin resistance) index according to daytime napping duration among men and women. Multivariate hazard ratios (HRs) were adjusted for age, sex, systolic blood pressure (SBP), smoking, alcohol use, physical activity, psychological pressure, bad mood, stroke, cardiovascular disease, mental illness, insomnia, use of hypnotics, sleep quality, night sleep duration, snoring, tea consumption, body mass index (BMI), and fasting blood glucose (FBG), triglyceride (TG), and high-density lipoprotein cholesterol (HDL-C) levels. In men (A), the HRs (95% CI) for HbA1c levels between 5.7% and 6.4% were 1.00 (reference), 1.02 (0.55–1.87), and 1.39 (0.75–2.58). The HRs (95% CI) for HbA1c >6.5% were 1.00 (reference), 0.61 (0.26–1.42), and 2.01 (1.07–3.80). The HRs (95% CI) for the high HOMA-IR index were 1.00 (reference), 0.91 (0.70–1.19), and 1.46 (1.08–1.98). In women (B), the HRs (95% CI) for HbA1c levels between 5.7% and 6.4% were 1.00 (reference), 1.07 (0.63–1.82), and 2.20 (1.43–3.38). The HRs (95% CI) for HbA1c >6.5% were 1.00 (reference), 1.36 (0.77–2.42), and 1.87 (1.04–3.35). The HRs (95% CI) for the high HOMA-IR index were 1.00 (reference), 1.06 (0.80–1.39), and 1.47 (1.12–1.91). ∗P trend < 0.05, ∗∗P trend < 0.01. BMI = body mass index, CI = confidence interval, FBG = fasting blood glucose, HbA1c = glycosylated hemoglobin, HDL-C = high-density lipoprotein-cholesterol, HOMA-IR = homeostasis model assessment of insulin resistance, HRs = hazard ratios, SBP = systolic blood pressure, TG = triglyceride.