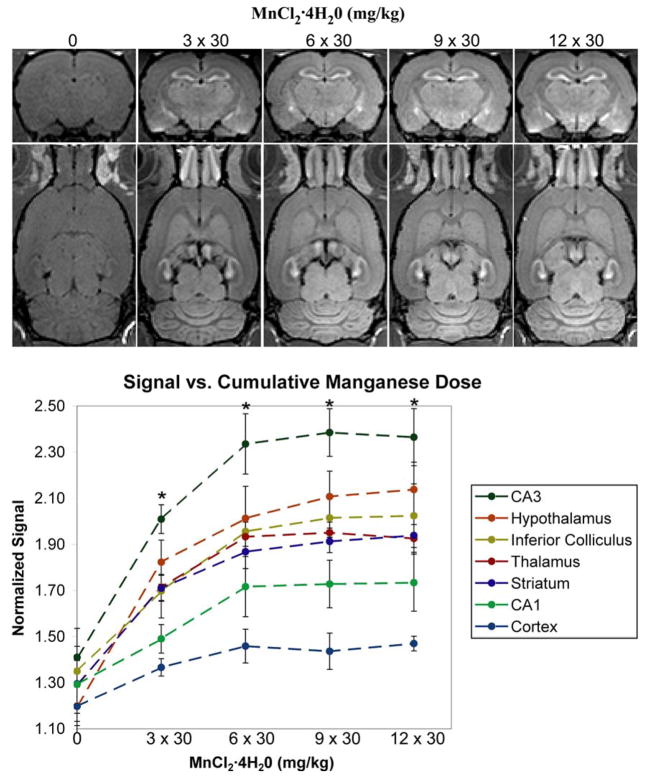
Figure 2.
The effect of increasing numbers of fractions of MnCl2 ·4H20 on the magnitude signal intensity in T1-weighted images. (Top) Representative coronal and horizontal slices from 3D T1-weighted images of a rat at each cumulative dose. (Bottom) A graph showing the magnitude signal from each brain region normalized to its value in the muscle surrounding the skull (error bars are standard deviations, n=4). The asterix denotes the manganese-injected groups of rats were significantly different from the control group (p≤0.05) – there were no significant differences between the injected groups.

