
Fig 3.
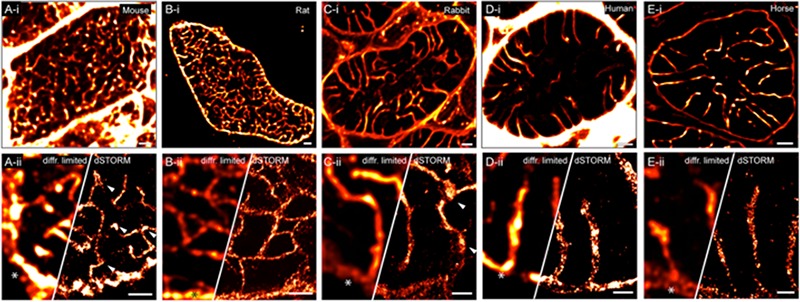
Comparison of micron- and nanometre-scale morphologies in adult mammalian cardiac t-systems. Transverse (i) Confocal and (ii) dSTORM images blurred with a 2D Gaussian PSF equivalent to a confocal PSF (left panels) and super-resolution image (right). Shown myocytes of (A) C57-BL/6 mouse and (B) Wistar rat were stained with a combination of NCX1 and CAV3. Fixed ventricular tissue sections from (C) New Zealand White rabbit, (D) Human (54-year old donor with normal echocardiogram) and (E) Horse (12-year old female New Forest pony) were stained with fluorescent wheat germ agglutinin to visualise the t-tubules. Note the nanometre- and micron-scale t-tubule dilatations in mouse and rabbit myocytes respectively (arrowheads). Cell surface in each example is indicated by asterisks. Scale bars: i-panels: 2 µm; ii: 1 µm.