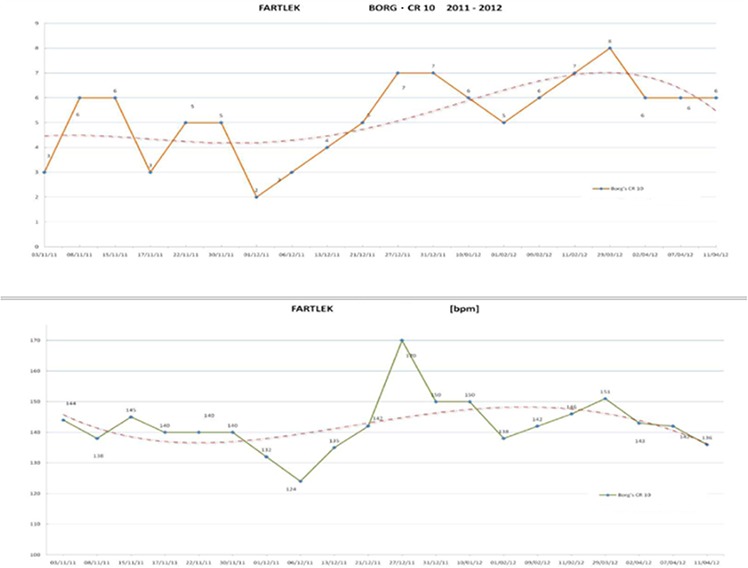
Fig 4.

Fartlek training in Italy and Kenya. The early period (before 6 December, 2011) shows that the Borg values decreased according to increased HR; in the later period, following the peak Borg values and HR, the Borg values remained similar to those of the early period, although a lower HR was recorded, indicating the effectiveness of the Fartlek training. Dotted line represents the tendency of the Borg values.
