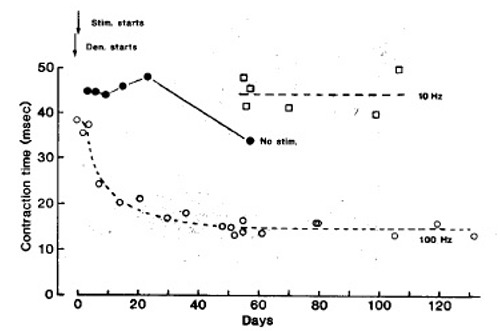
Fig. 3.

Isometric twitch contraction time of soleus muscles at different times after denervation and onset of electrical stimulation (arrows). represents the fast stimulation pattern (60 pulses at 100 Hz every min). represents the slow stimulation pattern [continous 10 Hz). represents denervated, non stimulated soleus muscles with sham electrodes implanted. Each is mean of 2 muscles. Some are means of up to 8 muscles. The other symbols represent single muscles.
