
Fig 1.
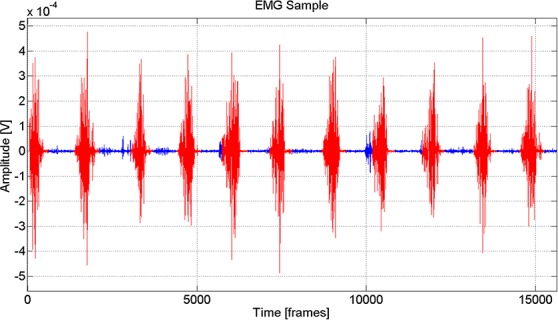
Sample raw EMG data depicting the results of the clustering methodology utilized to separate active and inactive chewing conditions (Red is active, and blue is inactive).
Official websites use .gov
A
.gov website belongs to an official
government organization in the United States.
Secure .gov websites use HTTPS
A lock (
) or https:// means you've safely
connected to the .gov website. Share sensitive
information only on official, secure websites.
Sample raw EMG data depicting the results of the clustering methodology utilized to separate active and inactive chewing conditions (Red is active, and blue is inactive).