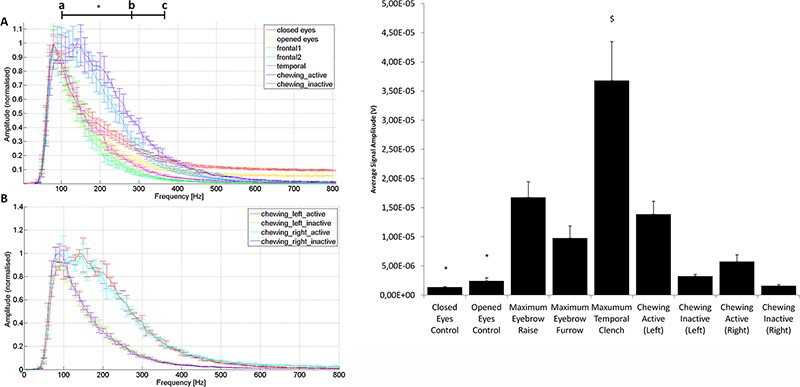
Fig 3.

Results from EMG signal FFT analysis and mean signal amplitude assessment. Note that the closed and open eyes conditions were both resting controls, frontal1 and frontal2 were maximum eyebrow raise and furrow conditions, respectively, temporal refers to the maximal temporal clench condition, and chewing active and inactive refer to the high-amplitude and low-amplitude portions of the chewing condition, as segmented by clustering analysis. A) Frequency spectra from each of the measured conditions (note that only the left side chewing condition was included in this plot). B) Frequency spectra for the left and right side chewing conditions. Statistical significance (*) was determined as p<0.05 in all assessments. C) Comparison of mean signal amplitudes across all measured conditions. Note that all conditions except for both chewing inactive datasets were significantly greater in amplitude than both control conditions (*). Likewise, the maximum temporal clench condition was significantly greater in amplitude than all other conditions ($). Statistical significance was determined as p<0.05 in all assessments.
