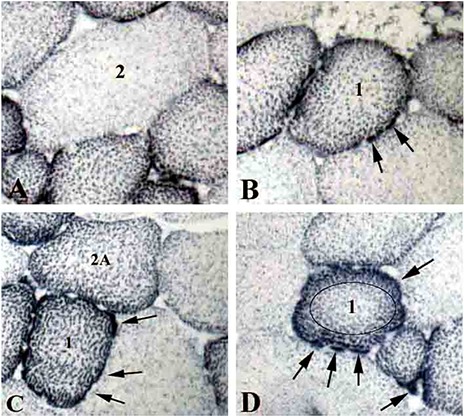
Fig 1.

NADH-TR reaction identifies mitochondria distribution and density in horse muscle biopsies.
A, a typical Type 2, large, glycolytic muscle fiber, low-density mitochondria is depicted; B and D, typical Type 1, smaller, oxidative muscle fibers are depicted; C, beside a typical Type 1 muscle fiber, a typical Type 2A glycolytic-oxidative muscle fibers is present. Arrows point to subsarcolemmal mitochondrial patches. In panel D the circle defines the central intermyofibrillar mitochondrial area. Magnification = 20 X
