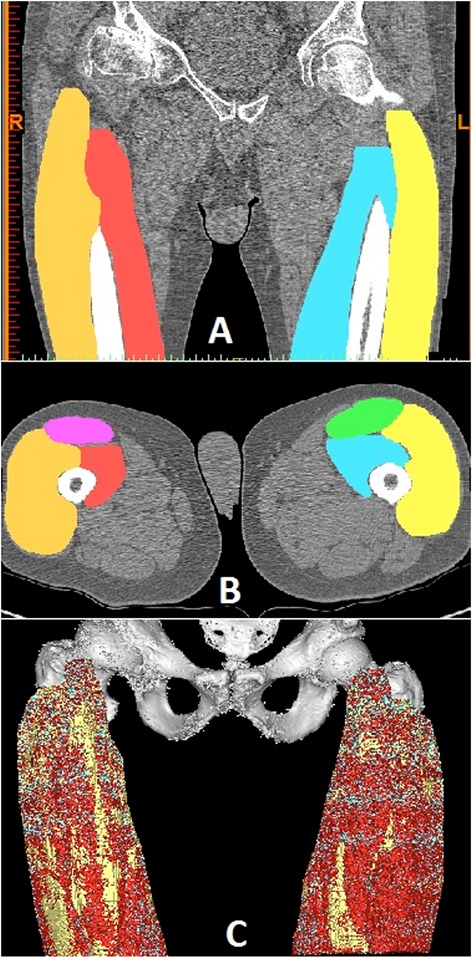
Fig 1.

A) CT slice in a coronal view showing the quadriceps muscles that are individually segmented. B) Axial view showing the segmentation of the quadriceps muscles in vastus lateralis, rectus femoris and vastus medialis. C) The quadriceps muscles and the femur bone in a 3D view after segmentation. The colors red, cyan and yellow represent respectively: muscle, dense connective and fat as defined in Gargiulo P, et al.27
