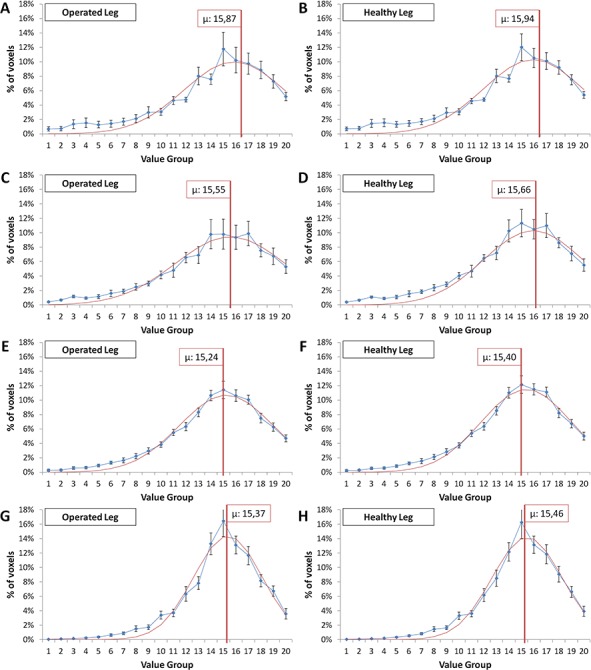
Fig 5.

Binned hounsfield unit (HU) distribution for patients grouped by age. The red and blue curves were generated analogously to those shown in Figures 3 and 4. A) and B) are patients less than 50 years old, C) and D) are patients between 51 and 61 years old, E) and F) are patients between 61 and 70 years old, and G) and H) are patients between 71 and 80 years old.
