
Figure 3.
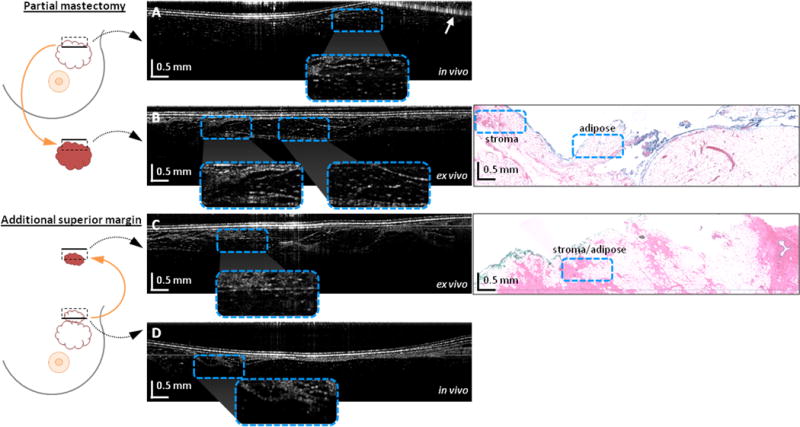
Video OCT cross-sectional images of a negative tumor margin from the in vivo resection bed and ex vivo excised tissue. Images are from a 56 year-old female WLE patient with invasive ductal carcinoma in the left breast. Diagrams on the left indicate the imaged regions (dashed boxes) of the resection bed or excised specimen (not to scale), and the solid black lines in the black dashed boxes indicate the top of the corresponding OCT image. (a) OCT image of the negative in vivo superior tumor margin. (b) OCT image of the negative ex vivo superior specimen margin, with corresponding histology. (c) OCT image of the negative additional ex vivo superior margin tissue (same tissue as imaged in vivo in (a)), with corresponding histology. (d) OCT image of the final negative in vivo superior margin. Areas of interest are magnified and shown in the insets to compare the normal stroma and adipose regions. The top right of the image in (a) is obscured by a complex conjugate artifact (arrow). Note that histology images are only provided for the corresponding OCT images in 3B and 3C since the images in 3A and 3D were acquired in vivo and hence do not have histology images to compare.