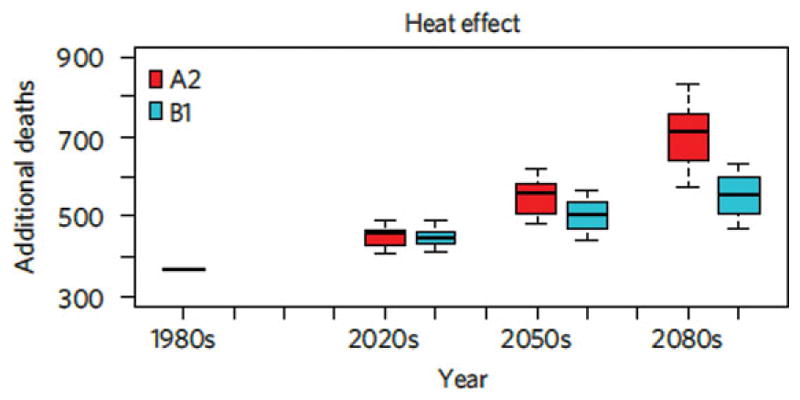
Figure 5.5.

Distribution of heat-related deaths in the 1980s (observed), 2020s, 2050s, and 2080s for 16 global climate models and two greenhouse gas emission scenarios. The A2 scenario assumes relatively high, and the B1 assumes relatively low, greenhouse gas emissions over the 21st century. Source: Li et al. (2013).
