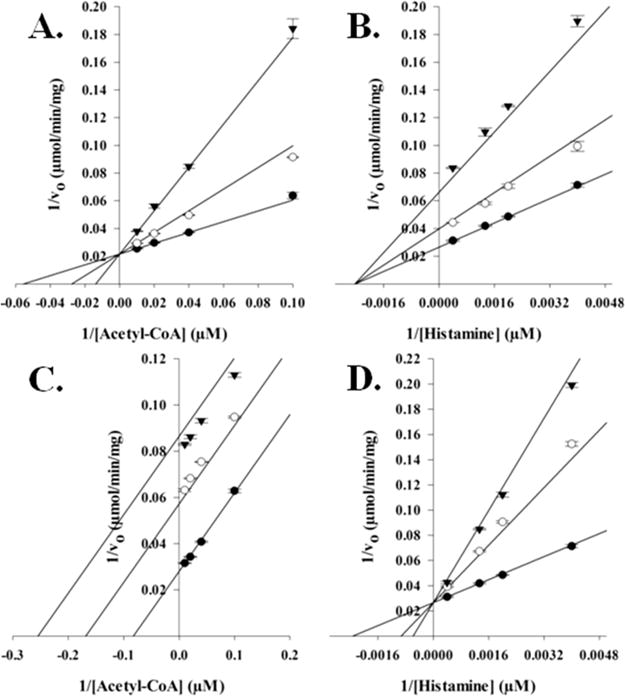
Figure 3.

Dead-end inhibition analysis of AANATL7. (A) Velocities measured at a fixed concentration of histamine (520 μM), varying the concentration of acetyl-CoA, and varying the concentration of the inhibitor, oleoyl-CoA: 0 nM (●), 200 nM (○), and 600 nM (▼) (Ki = 200 ± 10 nM). (B) Velocities were measured at a fixed concentration of acetyl-CoA (29 μM), varying the concentration of histamine, and varying the concentration of the inhibitor, oleoyl-CoA: 0 nM (●), 200 nM (○), and 600 nM (▼) (Ki = 410 ± 10 nM). (C) Velocities measured at a fixed concentration of histamine (520 μM), varying the concentration of acetyl-CoA, and varying the concentration of the inhibitor, tyrosol: 0 μM (●), 650 μM (○), and 1.3 mM (▼) (Ki = 620 ± 20 μM). (D) Velocities measured at a fixed concentration of acetyl-CoA (29 μM), varying the concentration of histamine, and varying the concentration of the inhibitor, tyrosol: 0 μM (●), 650 μM (○), and 1.3 mM (▼) (Ki = 430 ± 20 μM).
