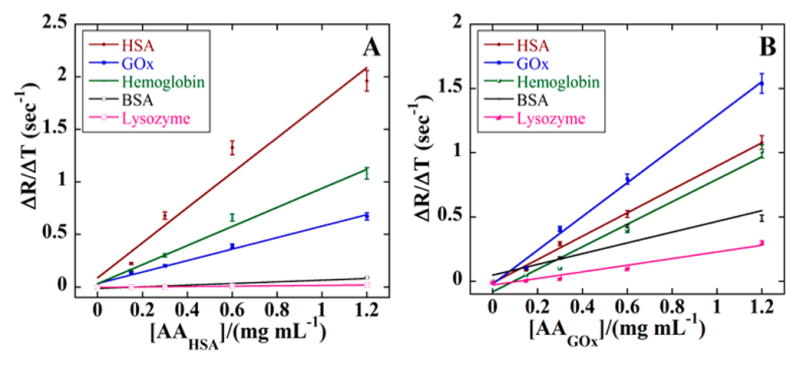
Figure 6.

Initial rates of SPR response vs concentrations of AAs. Slopes represent the apparent association rate constant for AAs for (A) HSA and (B) GOx with HSA (red) GOx (blue), bovine serum albumin (black), lysozyme (pink) and hemoglobin (green).
