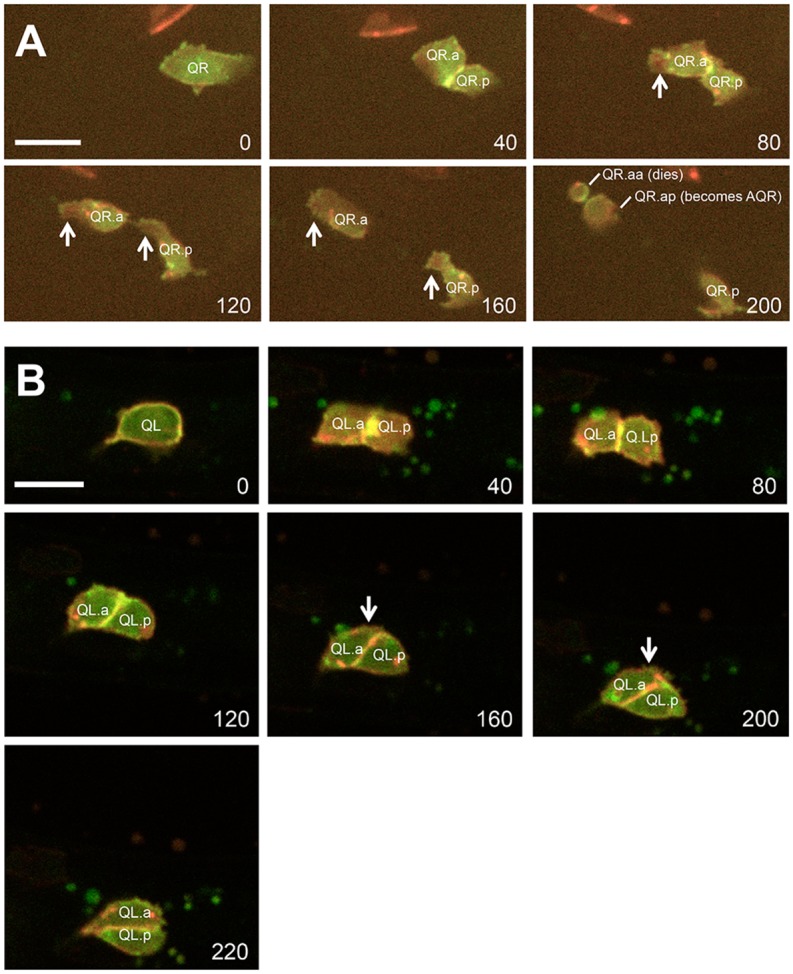
Fig 3. Time-lapse imaging of QR and QL descendant migrations.

Micrographs from time lapse imaging of QR (A) and QL (B) are shown, using the casIs330 transgene [31] (see Methods). Individual images were taken from S1 and S2 Movies at the timepoints in minutes indicated in the lower right of each micrograph. Red indicates MYR::mCherry at membranes and in chromatin (HIS-24::mCherry), and green represents F-actin (MOEabd::GFP). (A) QR and descendants are indicated. Arrows point to the F-actin-rich lamellipodial protrusions that accompany polarization and anterior migration. F-actin also accumulated at the furrows between dividing cells (e.g. between QR.a and QR.p at 40min, and between QR.aa and QR.ap at 200min). (B) QL and descendant migration. Arrows point to the extensions from QL.a posteriorly over QL.p. In these time-lapse imaging experiments with the casIs330 transgene, migrations and cell divisions were delayed by ~2-fold compared to ayIs9 still images, but the same pattern of QL.a/p and QR.a/p migration as observed with ayIs9 still images was conserved.
