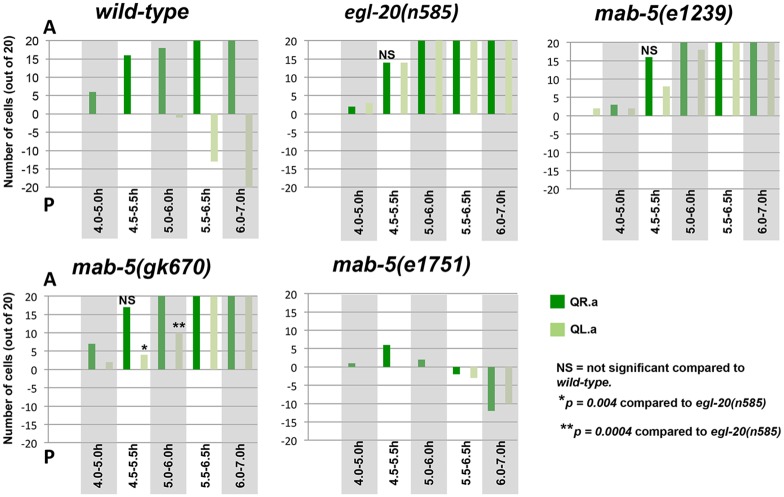
Fig 4. Quantitative representation of Q descendant migrations.
Graphs represent Q migrations in indicated genotypes. The number (out of 20) of QR.a (dark green) and QL.a (light green) that had migrated (Y axis) at each timepoint (X axis) are indicated. Positive numbers on the Y axis represent anterior migration, and negative numbers represent posterior migration. A cell was scored a migratory if it extended an anterior lamellipodial like protrusion and separated from its sister (for anterior migration) or if it extended a posterior protrusion over its sister or migrated behind its sister (for posterior migration).

