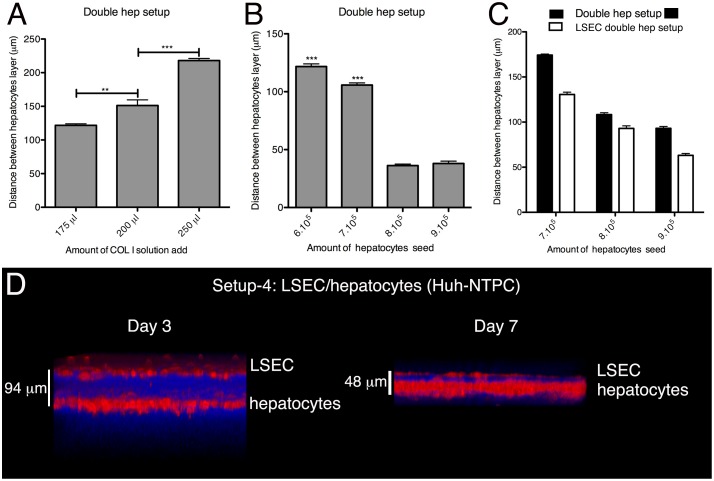
Fig 2. Development of the 3D liver model setups: control of the COL-I matrix height separating hepatocyte layers.
(A) Double hepatocyte layer model (setup 2) built with identical cell numbers seeded and different amounts of COL-I solution used for the matrix separating the cell layers. The graph represents the distance between the two hepatocyte layers after 3d of culture. (B) The same setup 2 with different cell numbers seeded at the up hepatocytes layer but identical volumes of COL-I solution (175ul). Graphic representation of the distance between the two hepatocyte layers after 3d of culture. (C) Setup 2 seeded with indicated numbers of hepatocytes, co-cultured or not with an LSEC layer (setup 3). The graph shows the distance between the two hepatocyte layers. A-C) data obtained from 3 independent experiments. Standard deviation and statistical significance indicated, with ** = p < 0.01 and *** = p < 0.001. (D) 3D transversal reconstruction (ICY software) of two-photon microscopy acquisitions of LSEC/single hepatocyte layer 3D liver model (setup 4) after 3d or 7d of culture. Cells were labelled with red cell tracker, COL-I fibres visualized by SHG signals (in blue).

