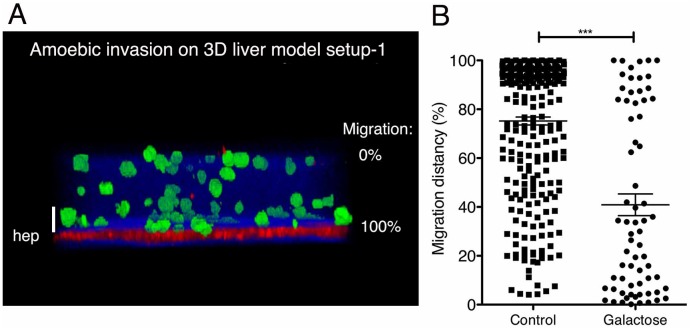
Fig 3. 3D liver model with single hepatocyte layer: visualization and quantification of the 3D directional migration of E. histolytica.
(A) 3D transversal reconstruction (ICY software) of a two-photon microscopy image of 3D liver system setup 1 at 3h after addition of virulent trophozoites on top of the model. Hepatocytes labelled with red cell tracker, amoebae with green cell tracker. COL-I fibres visualized by SHG signal (in blue). (B) Quantification of the directional migration of amoebae towards the hepatocyte layer, in the presence of 100mM glucose (control) or galactose. The migration distance (i.e. migration towards hepatocytes) was obtained by considering the amoeba position relative to the position of the matrix top and the hepatocyte layer, set as 0% and 100%, respectively (indicated in A). For each condition, 10 fields of 5 independent experiments were examined. Mean values with standard deviation and statistical significance indicated, with *** = p < 0.001. Scale bar = 50μm.

