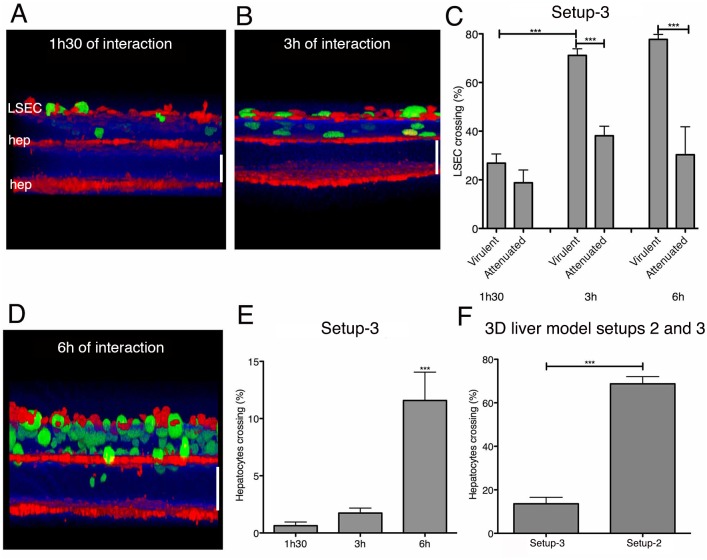
Fig 5. 3D liver model with LSEC and double hepatocyte layers: visualization and quantification of LSEC and hepatocytes crossing by E. histolytica.
For two-photon microscopy acquisitions, hepatocytes were labelled with red and amoebae with green cell tracker. Col-I fibres were visualized by SHG signal (in blue). 3D transversal reconstruction (ICY software) of images acquired at 1.5h (A) and 3h (B) of virulent amoebae interaction with the model. (C) Quantification of LSEC crossing by virulent and virulence-attenuated E. histolytica. (D) 3D transversal reconstruction (ICY software) of image acquired after 6h of interaction, visualizing amoeba crossing of the upper hepatocyte layer. (E) Quantification of the hepatocyte layer crossing by E. histolytica at indicated time-points of interaction. (F) Amoebic hepatocyte crossing rate in the LSEC/double hepatocyte layer (setup 3) and double hepatocyte layer system (setup 2, i.e. without LSEC). (C), (E) and (F) obtained from 3 independent experiments. Standard deviation and statistical significance indicated, with *** = p < 0.001. Scale bar = 100μm.

