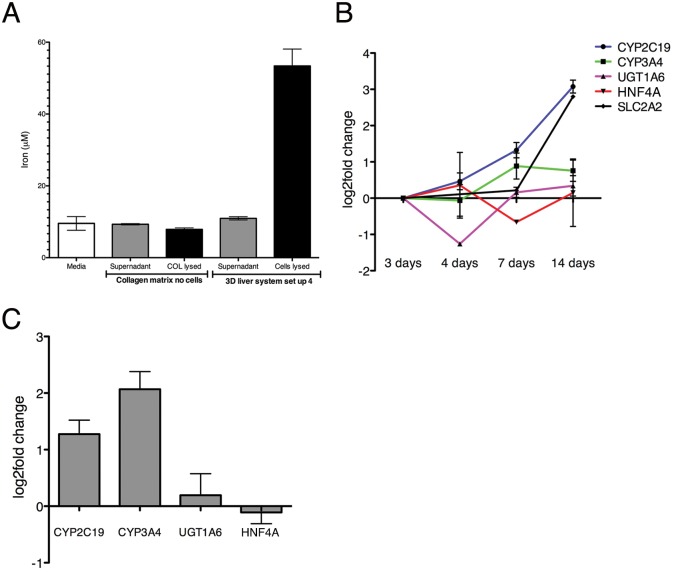
Fig 6. Hepatic marker expression in the 3D liver model (setup 4) with a single Huh7-NTCP hepatocyte and LSEC layer.
(A) Iron accumulation in hepatocytes cultivated in the 3D liver system setup 4 for 3 days. Iron concentration in cell culture supernatant and in hepatic cells lysates. Medium alone and cell-free COL-I matrix (soluble and lysed pellet fraction) used as controls. (B) Expression level of transcripts for selected hepatic markers between 3-14d of culture, determined by q-PCR, and represented as fold change compared to the respective levels observed at 3d. (C) Hepatic marker expression in the 3D liver model with Huh7-NTCP compared with the 3D liver system with not transfected Huh-7 cells. Transcript levels determined by q-PCR and presented as fold change detected for Huh7-NTCP. Data obtained from three independent experiments. Standard deviation indicated.

