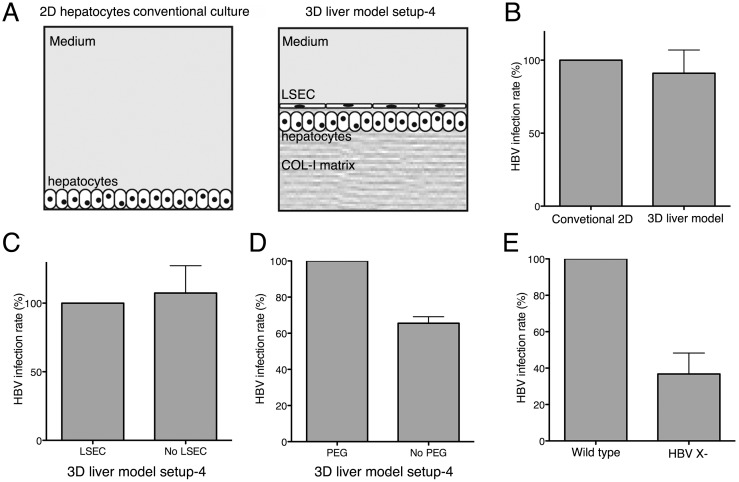
Fig 7. HBV infection rate at the 3D liver model setup 4.
(A) Schematic representation of 2D conventional hepatocyte cultures and the 3D liver system used for HBV infection experiments. (B-E) Cells were infected with either HBVwt or HBV X- as indicated at MOI of 20 genome equivalents/cell. Total RNA was extracted 4 days after infection and HBV infection level was analysed by measuring HBV transcription by RT-qPCR. (B) Infection rates obtained with conventional 2D cultures and on the 3D liver system. (C) HBV infection rate for the 3D liver model with Huh7-NTCP upon co-culture with LSEC (setup 4) and in the absence of LSEC (setup 1) (D) or in the presence or absence of PEG. (E) 3D liver model HBV infection rate compared between wild type and HBV X- particles. Data obtained from two independent experiments. Standard deviation indicated.

