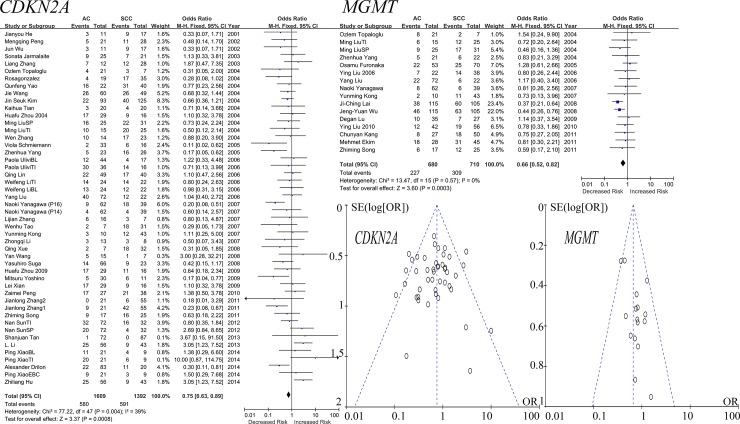
Fig 2. Forest and funnel plots of CDKN2A and MGMT.
The forest plots of CDKN2A and MGMT displayed the effect size and 95% CIs for the included studies. Funnel plots suggested no publication bias in the meta-analyses of CDKN2A and MGMT genes. Our results showed that the total ORs for CDKN2A and MGMT were less than1, which demonstrated the methylation of CDKN2A and MGMT in AC were relatively higher than in SCC. Funnel plots of meta-analyses of CDH13, RUNX3 and APC demonstrated no publication biases in the included studies. In addition, M-H denotes Mantel-Haenszel statistical method to calculate the combined odds ratios (ORs) and the corresponding 95% confidence intervals (95% CIs). Weight denotes the weighted average of the intervention effect estimated in each study. SE denotes standard errors.

