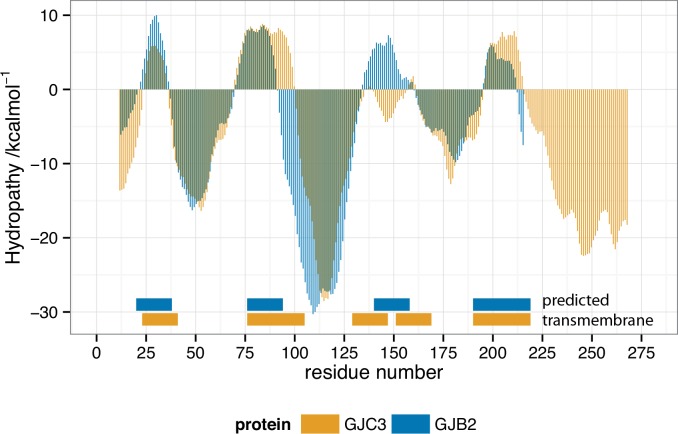
Fig 8. Wimley-White hydropathy plot of GJC3 (orange) and GJB2 (blue) showing predicted transmembrane regions as positive negative values.
Wimley-White octanol-to-water scale smoothed values for GJC3 and GJB2 are shown, where positive hydropathy values indicate expected membrane associated residues. The predicted transmembrane (TM) segments indicated are at least 19 residues in length and were calculated using a validated algorithm [126]. Wimley-White smoothed hydropathy calculated using MPEx [127] http://blanco.biomol.uci.edu/mpex/ and replotted using ggplot2 in R [125].

