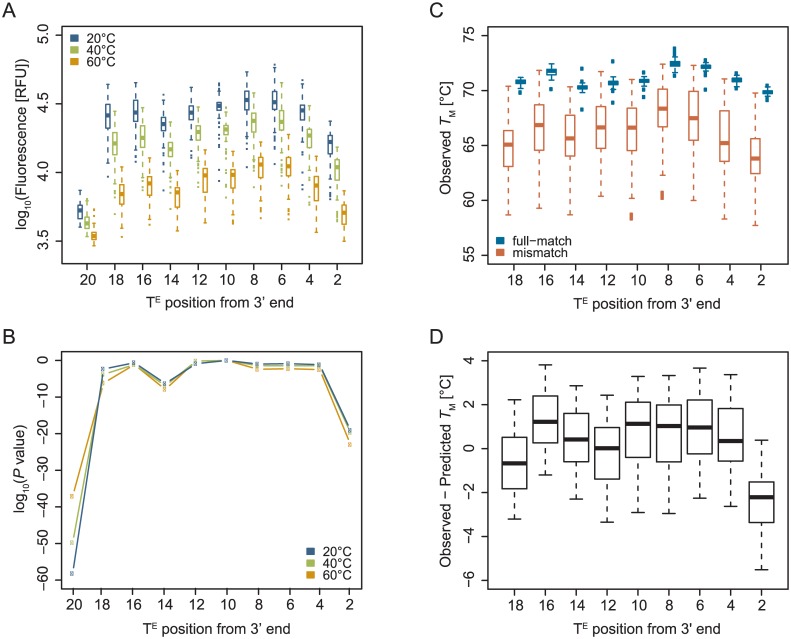
Fig 5. Positional effect of thiazole-orange labelled nucleotide within ECHO on (A) fluorescence intensity (at 20, 40 and 60°C) and its P value (B) by comparing with ECHO labelled at the center (position 10) (Student’s T test, two-tailed), (C) TM obtained from melting curve analysis (boxplots separated by with or without mismatch), and (D) difference between the predicted and observed TM values.
In graph A, each boxplot summarizes fluorescent melting curve experiments of one ECHO with 61 complementary oligonucleotides (one full-match and 60 single-base mismatch sequences), using mean values among replicates of each ECHO/DNA pair. In graph C, each boxplot summarizes obtained TM values of one ECHO with one full-match or 60 single-base mismatch sequences, using all replicates. In graph D, each boxplot summarizes differences between predicted and obtained TM values of one ECHO with single-base mismatch sequences, whose labelled nucleotide located more than two nucleotides away from a mismatch, using mean values among replicates of each ECHO/DNA pair.

