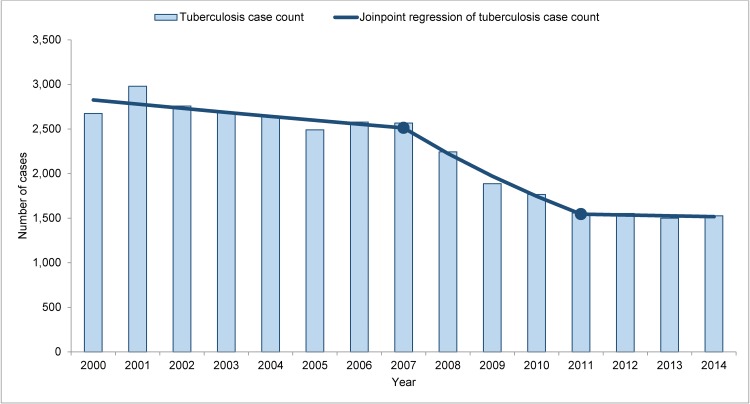
Fig 1. Tuberculosis case counts with Joinpoint regression among recent entrants, 2000–2014.
Shaded bars indicate tuberculosis case counts among recent entrants (foreign-born persons with <3 years since U.S. entry). The solid line represents a Joinpoint regression of tuberculosis case counts. Solid circles represent statistically significant changes in trend in 2007 and 2011 (2000–2007 annual percent change, -1.7% [95% confidence interval {CI}, -3.5%, +0.2%); 2007–2011 annual percent change, -11.4% (95% CI -17.4%, -5.1%)]; 2011–2014 annual percent change, -0.6% [95% CI, -7.3%, +6.5%]).

