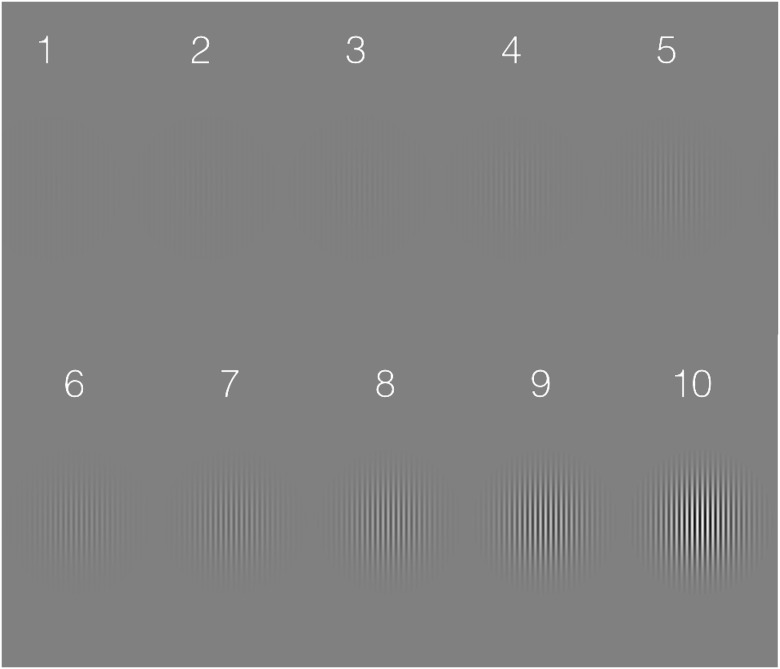
Fig 1. Examples of the 10 Gabor patches used in the contrast-rating task in Experiment 1.
On a gamma-corrected monitor, the contrast of these stimuli will appear to increase in logarithmically-spaced steps between 1% (1) and 100% (10). In a block of the task during Experiment 1, each Gabor was presented once in a pseudo-randomized order and the participants rated where it fell on the 1–10 scale. Note the stimuli are not drawn to scale for a reading distance but the relative size of the envelope and carrier are correct.

