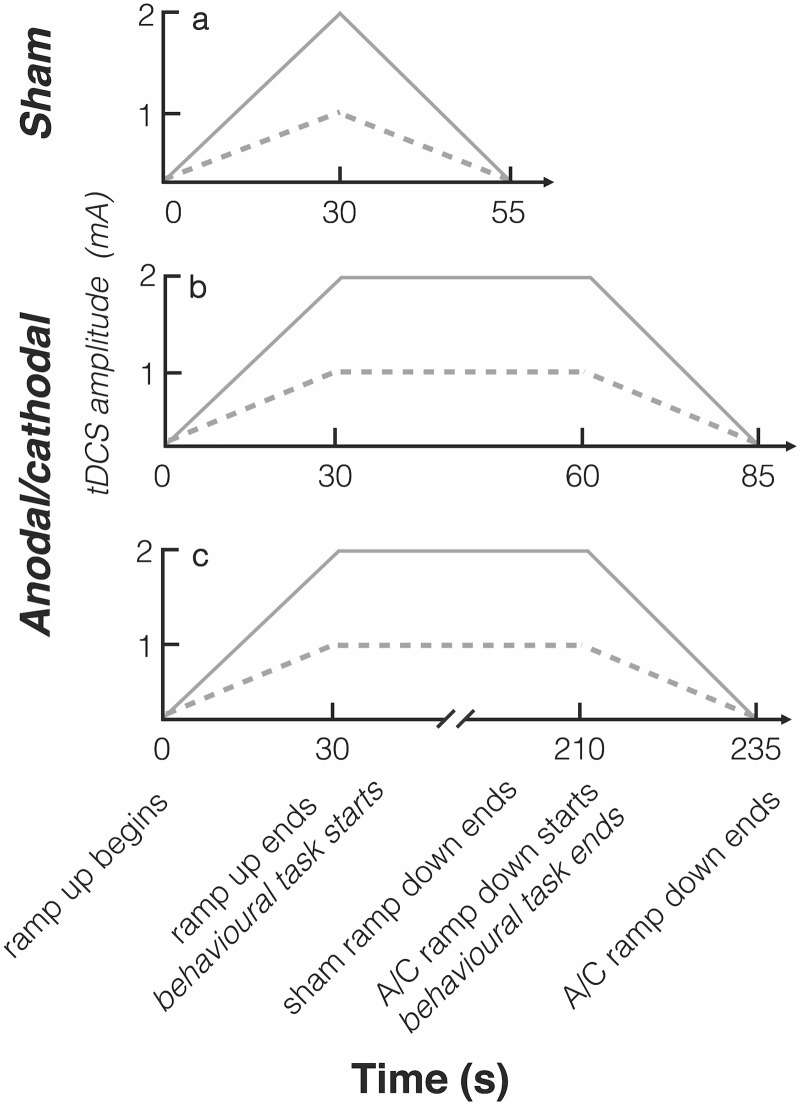
Fig 2. A schematic illustration of the current intensities for the different stimulation types over time.
The same sham condition (a) was used in both Experiments 1 and 2. The dotted line indicates the 1 mA current intensity and the solid line indicates the 2 mA current intensity trials. The time course differed for the active conditions between Experiment1 (b) and Experiment 2 (c). The behavioral tasks begun after the end of the ramp up period for both active and sham stimulation types and lasted ~30 s.

