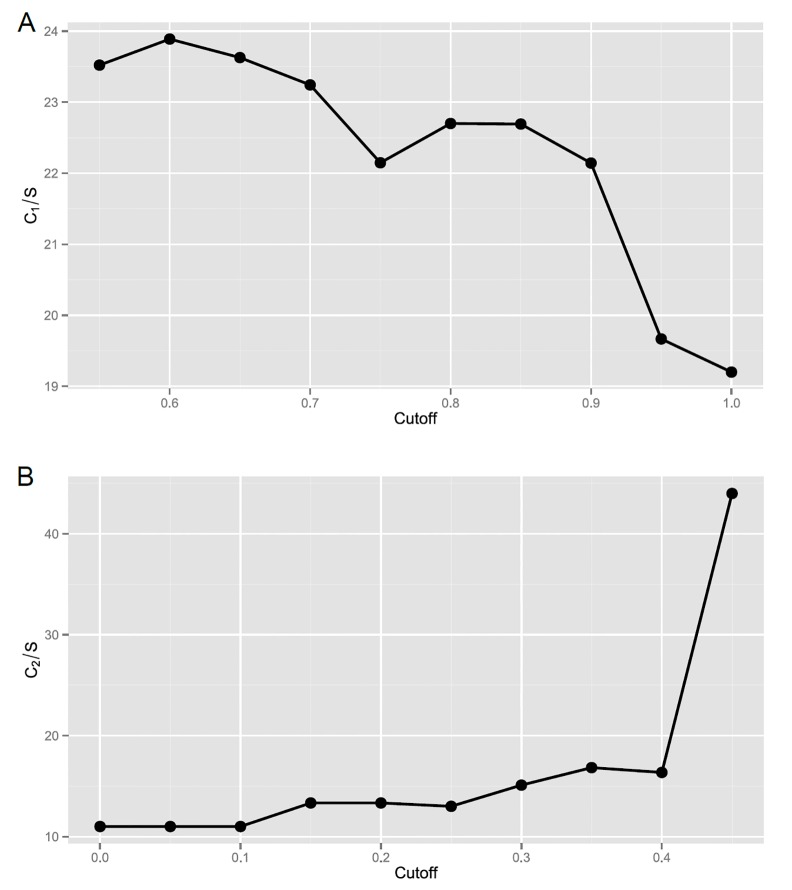
Fig 2. The C/S distribution plots according to different mutagenicity cutoff values.
(A) In selecting mutagenic scaffolds, using the mutagens categorized in each selected scaffold as the selection criteria (C1/S). The detailed scores were listed in Table A in S1 File. (B) In selecting non-mutagenic scaffolds, using the non-mutagens categorized in each selected scaffold as the selection criteria (C2/S). The detailed scores were listed in Table B in S1 File. (C1: number of mutagenic compounds, C2: number of non-mutagenic compounds, S: number of mutagenic (for C1) or non-mutagenic (for C2) scaffolds).

