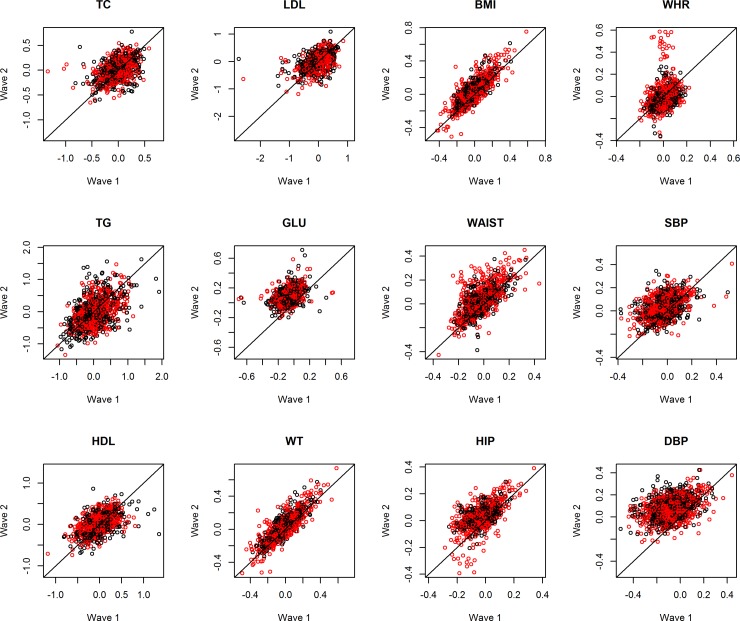
Fig 1. Trend of metabolic phenotypes over time in Danish twins.
Scatter plots showing the residuals of phenotype measurement from the mixed effect model at time 1 (horizontal axis) against that at time 2 (vertical axis) for 12 phenotypes in Danish twins (females in red; males in black). TC: total cholesterol; TG: triglycerides; HDL: high density lipoprotein cholesterol; LDL: low density lipoprotein cholesterol; GLU: fasting blood glucose; WT: body weight; BMI: body mass index; WAIST: waist circumference; HIP: hip circumference; WHR: waist-to-hip ratio; SBP: systolic blood pressure; DBP: DP: diastolic blood pressure.

