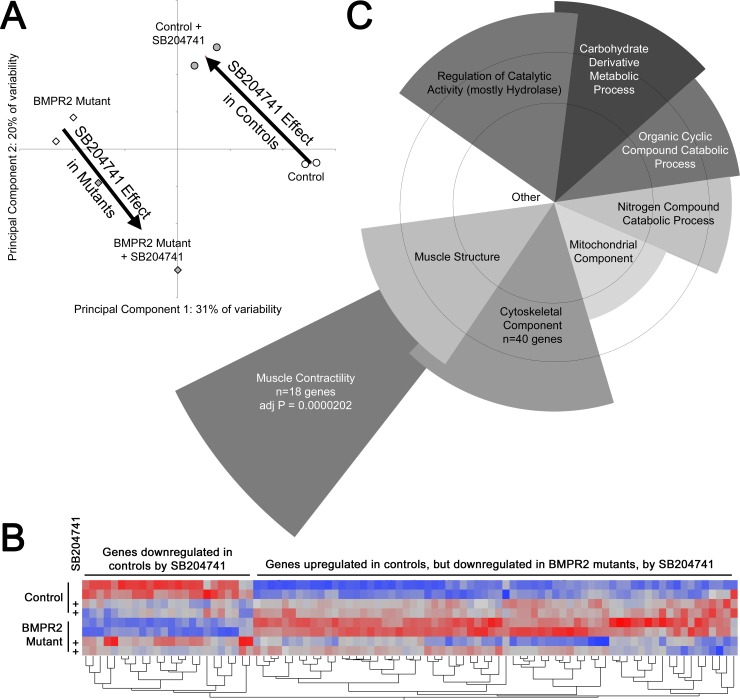
Fig 5.
(A): Principal components analysis found a strong difference between BMPR2 mutants and controls along Principal Component 1 (PC1). Treatment with SB204741 caused nearly opposite changes in PC vector in control and mutant mouse lungs (large arrows). Circles and diamonds refer to individual arrays for control and BMPR2 mutants respectively: open and filled shading are for vehicle and SB204741 treatment respectively. (B): Heat map of normalized gene expression for 100 genes most affected by SB204741 treatment. Each column is a gene, with rows treatment/genotype groups. Red corresponds to high expression and blue to low. In general, SB204741 eliminates differences between control and BMPR2 mutant mice, by moving gene expression in opposite directions (BMPR2 mutants become more like controls, but controls become more like BMPR2 mutants). (C): Representative examples of significantly overrepresented gene ontology groups. Angular width of each wedge is proportional to the number of genes altered by SB204741 in the group as a fraction of the 234 with a 95% confidence of change of over 20%. Radius is proportional to–log of the p-value (so longer is more significant). Circles correspond to multiple comparisons adjusted p = 0.05 and p = 0.01. Overlap is approximate, and demonstrates that most genes belong to more than one ontology group (lower level ontology groups not shown).

