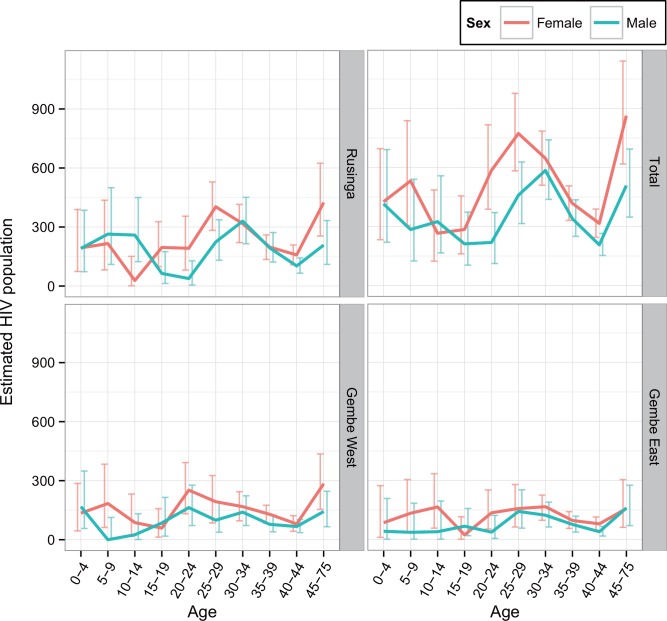
Fig 3. The estimated HIV positive population by sub-area of the study site according to age and sex.
The horizontal axis shows five-year age groups, and the vertical axis shows the prevalence of HIV positive cases. Red and blue lines with error bars indicating 95% confidence intervals represent females and males, respectively.

