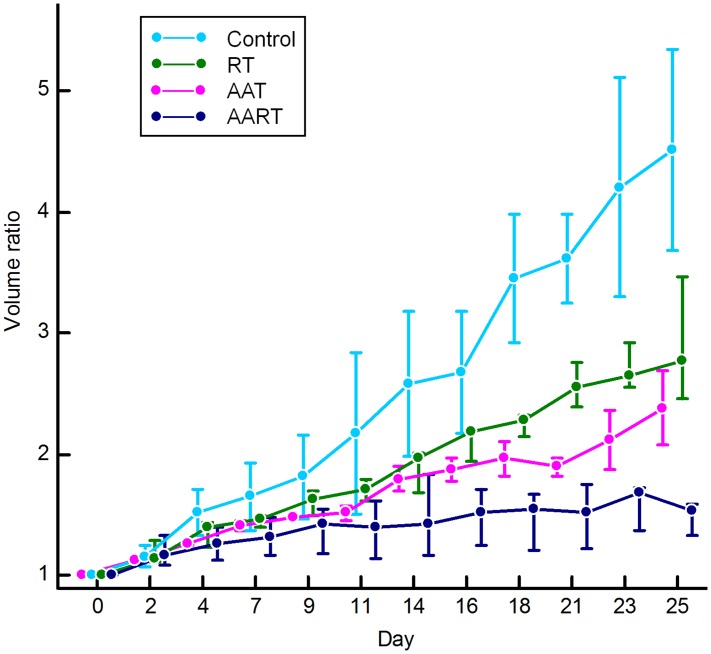
Fig 2. Tumor growth curves obtained by measuring the volumes of the tumors in the study groups.
The volume ratio of the tumor was obtained from the initial volume (V0) at the onset of the treatment (Day 0) to the following day. On the tumor growth curve, the mean volume ratio in each group on the follow-up dates was plotted. In the AART group, the tumor growth rate is much more suppressed than those in the other groups. RT, radiation therapy; AAT, antiangiogenic agent therapy; and AART, AAT plus RT.

