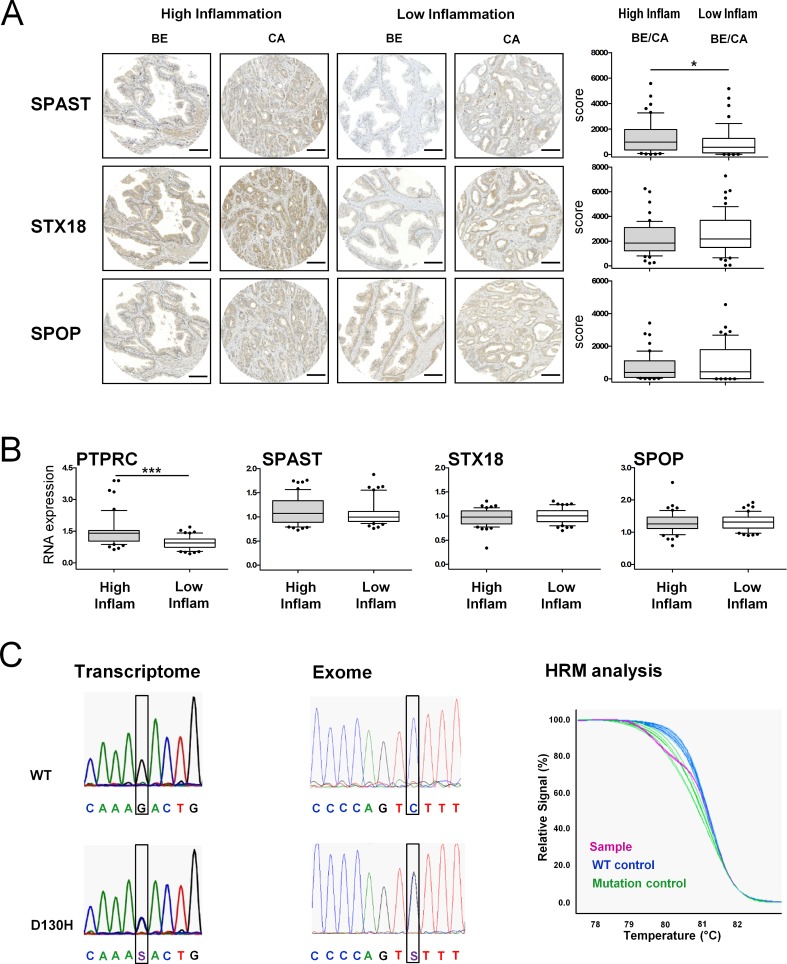
Fig 2. Quantification of corresponding autoantigen levels in prostate tissue.
A Immunohistochemical stainings of representative tissue microarray spots from high and low inflammation patient cohorts. SPAST, STX18 and SPOP are expressed in the epithelium of benign (BE) and cancer (CA) areas of both cohorts. Quantitative analysis was performed using the HistoQuest immunohistochemistry analysis software (TissueGnostics). A score was calculated by multiplying staining intensity and percentage of positively stained cells. n = 25 per group. *P<0.05, Mann-Whitney Test. Bar, 100μm. B Quantification of the pan-lymphocyte marker CD45 (PTPRC) and autoantigen mRNA levels in high and low inflammation patient groups. n = 25 per group. ***P<0.001, Mann-Whitney Test. C Electropherograms of transcriptome (5’-3’) and exome (3’-5’) sequencing results depicting wild-type and D130H SPOP mutation sequences. High resolution melting curves for mutated and wild-type DNA: The purple melting curve of the sample consists of 50% mutant and 50% wild-type DNA.

