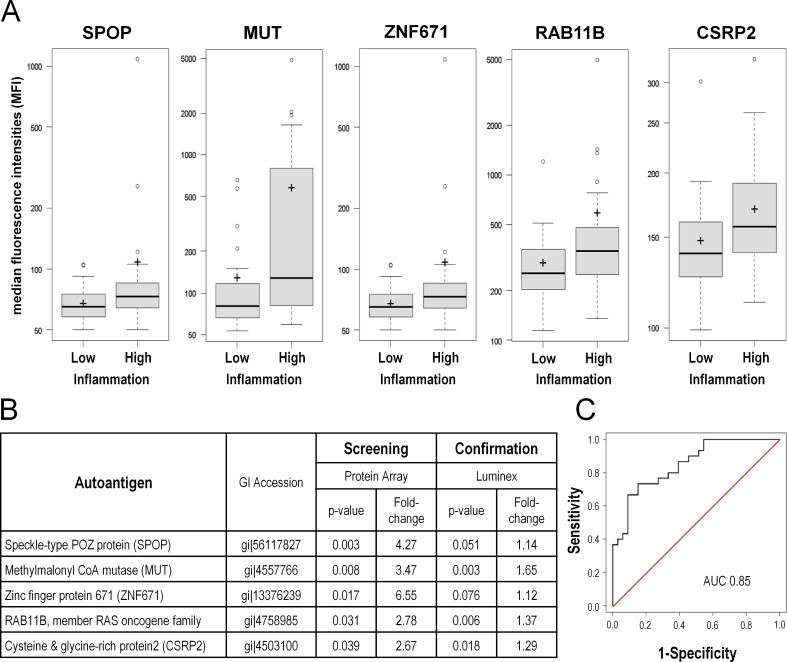
Fig 3. Cross-validation of identified autoantibody profile using a Luminex-beads protein array.
The identified profile was validated in an independent set of prostate cancer patients (n = 60) using the bead-based Luminex technology to identify autoantibodies. A Box plots of mean fluorescent intensities (MFI) values for the five top autoantibody candidates significantly increased in the prostate high inflammation group in both screens. B Table displaying fold-change and p-values of the autoantibodies significantly upregulated in high-inflammation serum samples of the screening and validation patient cohorts. C ROC curve for the top five autoantibodies for the classification of samples of the validation set. The identified biomarker profile discriminates between high and low inflammation patients with an AUC of 0.85.

