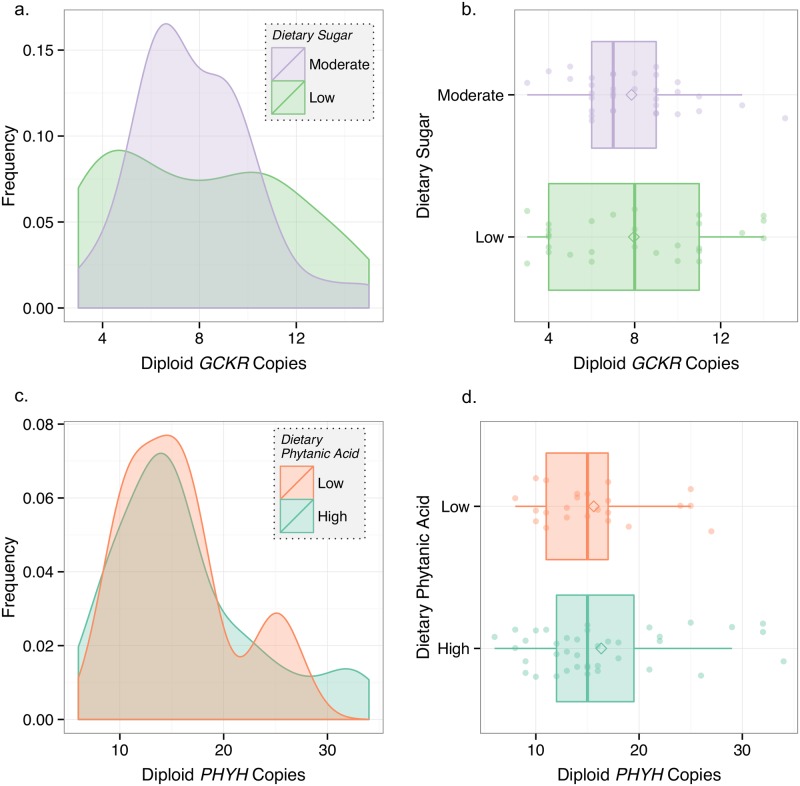
Fig 1. Diet and GCKR and PHYH copy number variation.
a) Density plot of ddPCR diploid GCKR copy number for dogs that traditionally consumed high sugar diets and low sugar diets. Density reflects frequency with which a given diploid copy number appears in each population. b) Tukey boxplot of diploid GCKR copy number for dogs that traditionally consumed high sugar diets and low sugar diets. c) Density plot of ddPCR diploid PHYH copy number for dogs that traditionally consumed high phytanic acid diets and low phytanic acid diets. d) Tukey boxplot of diploid PHYH copy number for dogs that traditionally consumed high phytanic acid diets and low phytanic acid diets.

