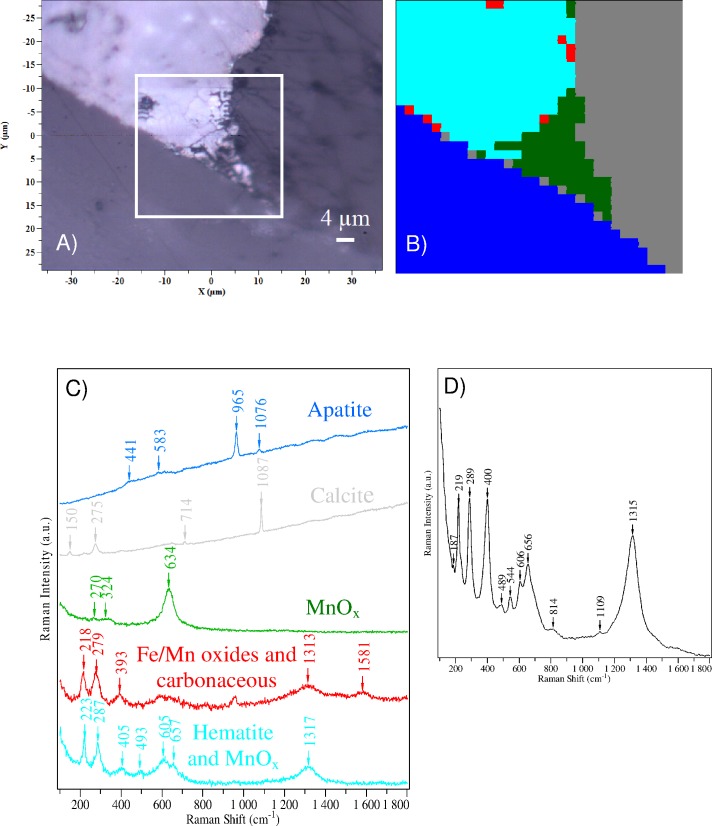
Fig 7. Raman spectral data collected from mineralised mycelium.
(A) Microscopic image of the studied bone in reflected light; the frame marks the mapping areas from which Raman spectra were collected (B) Colour-coded Raman map of five clusters after hierarchical cluster analysis (HCA), based on spectral similarities for the bone section studied here, shown in (A). Colour codes are assigned to each of the five identified clusters (C) The representative cluster Raman spectra obtained from HCA. Colours represent individual cluster classes (D) A representative Raman spectrum collected from mineralised mycelium. Specimen ZPAL MgD I/alt.

