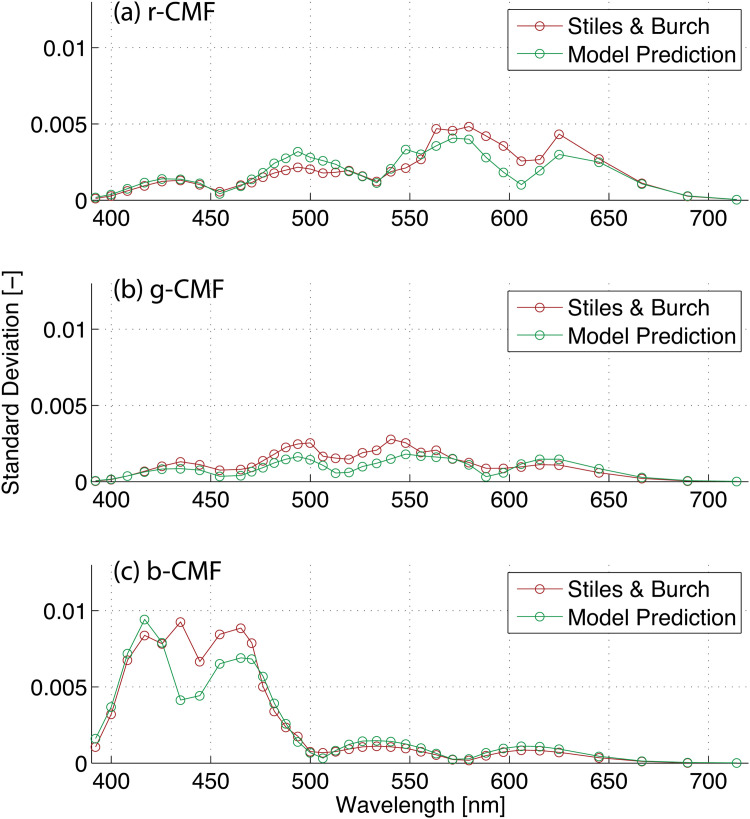
Fig 3. Standard deviations computed for Stiles and Burch’s 49 observers (red lines) and for 49 sets of rgb-CMFs generated by the proposed observer model (green lines).
The plot (a), (b), and (c) show standard deviations in red, green, and blue CMFs, respectively. Area-normalized rgb-CMFs are used to compute standard deviations in these plots.

