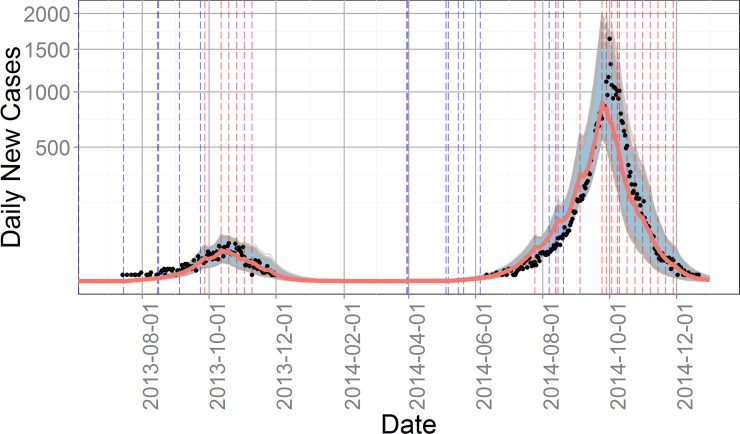
Fig 4. Trajectories for daily new cases of the 637 passing parameter sets in Cycle 5.
Black dots indicate the number of daily new cases from Guangzhou CDC, while gray lines are model outputs and red line is the median for all outputs. Blue and red vertical dash lines stand for washout and intervention days, respectively. Blue shaded area for the 90 percent interval for all 637 simulations.

