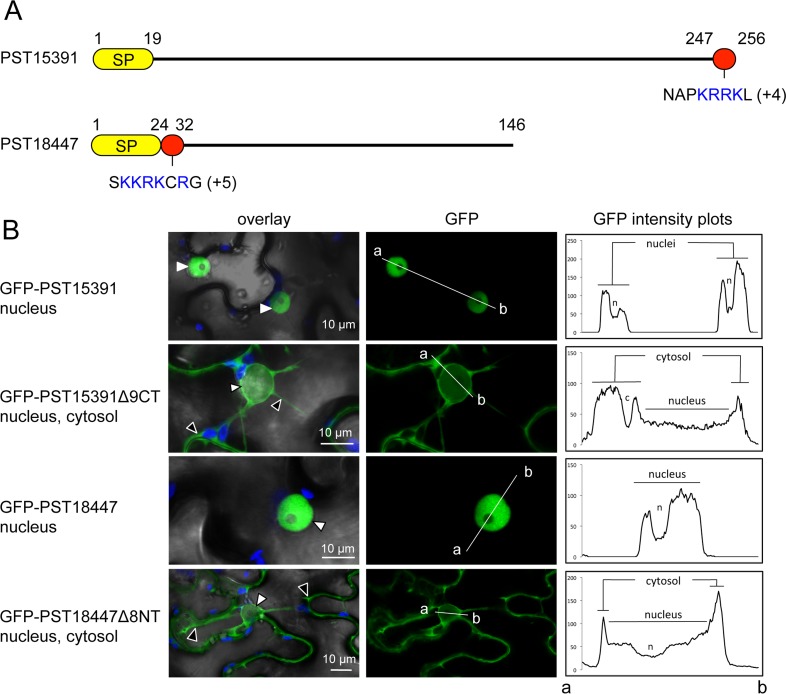
Fig 2. PST15391 and PST18447 carry functional nuclear-localisation signals.
(A) Schematic representation of the protein primary structure of PST15391 and PST18447. Yellow: predicted signal peptide for secretion; red: amino acid sequence necessary for nuclear accumulation; blue: positively charged residues (net charge is indicated in parentheses). Numbers indicate amino acid positions. (B) Live-cell imaging of GFP-PST15391, GFP-PST15391Δ9CT, GFP-PST18447, and GFP-PST18447Δ8NT in N. benthamiana leaf cells. The cellular compartments in which the GFP signal accumulates are indicated. The left-hand side panel shows overlay images of bright field, chlorophyll, and GFP channels. The central panel shows GFP channel images. The right-hand side panel shows fluorescence intensity plots of the GFP along the line from a to b depicted in corresponding central panel images. Proteins were transiently expressed in N. benthamiana leaf cells by agroinfiltration. Live-cell imaging was performed with a laser-scanning confocal microscope two days after infiltration. GFP and chlorophyll were excited at 488 nm. GFP (green) and chlorophyll (blue) fluorescence were collected at 505–525 nm and 680–700 nm, respectively. Images are single optical sections of 0.8 μm or maximal projections of up to 3 optical sections (max. z-stack of 2.4 μm). White arrowheads: nuclei; black arrowheads: cytosol.

