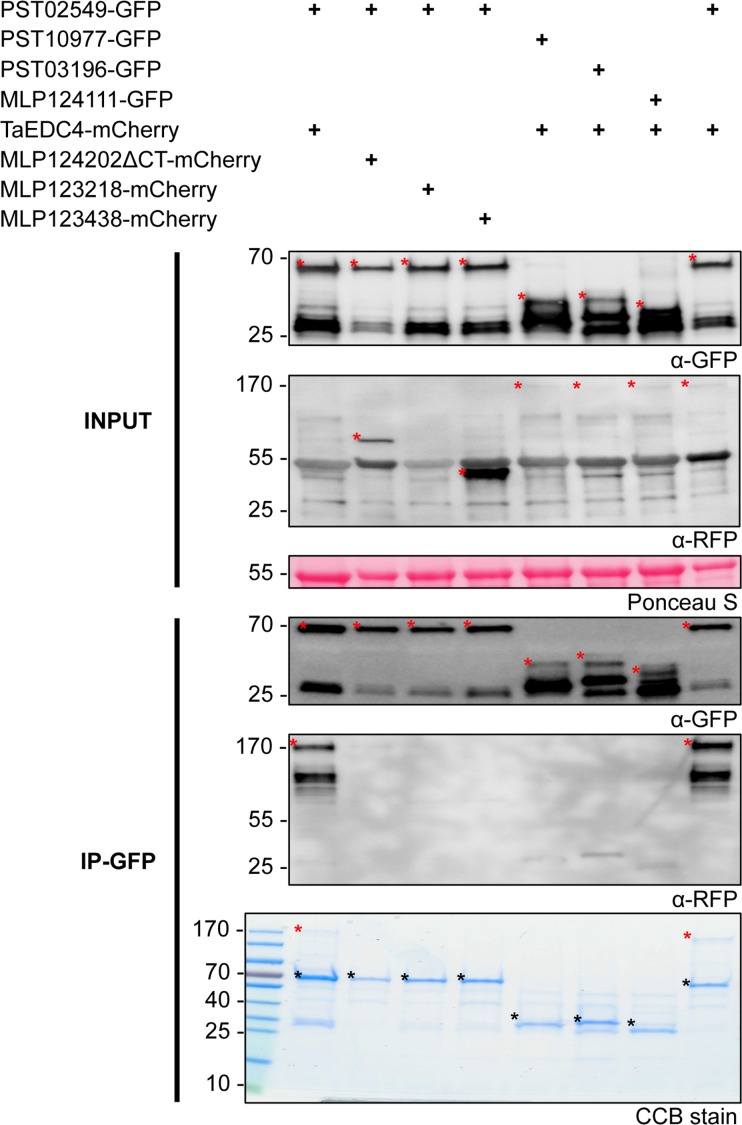
Fig 6. PST02549 associates with TaEDC4 in planta.
Anti-green fluorescent protein (GFP) coimmunoprecipitation followed by immunoblot and sodium dodecyl sulphate-polyacrylamide gel electrophoresis/Coomassie Brilliant Blue (SDS-PAGE/CBB) analyses. Proteins were transiently expressed in N. benthamiana leaf cells by agroinfiltration. Total proteins were isolated two days after infiltration, and immediately used for anti-GFP immunoprecipitation. Immunoprecipitated protein mixtures were separated with SDS-PAGE. For direct protein visualization, the acrylamide gel was stained with CBB. For immunoblotting, proteins were electrotransferred onto polyvinylidene fluoride (PVDF) membranes. Immunodetection was performed with anti-GFP or anti-redu fluorescent protein (RFP) antibodies, and immunoblots were revealed with a chemiluminescent imager. Ponceau S staining of the PVDF membrane was used as a loading and transfer control. Theoretical protein size is indicated in parentheses in kilodalton (kDa) for each fusion protein. Numbers to the left of the blot and gel images indicate protein size in kDa. In the immunoblot images, red asterisks indicate specific protein bands. In the gel image, asterisks indicate specific protein bands (red: TaEDC4-mCherry; black: GFP fusions); the PageRuler ladder is shown to the left of the image. IP: immunoprecipitation. In the IP-GFP/ α-RFP blot, note that the weak band signals observed on the right side between 25 and 40 kDa are due to non-specific background detection of abundant GFP fusions by the anti-RFP antibodies.

