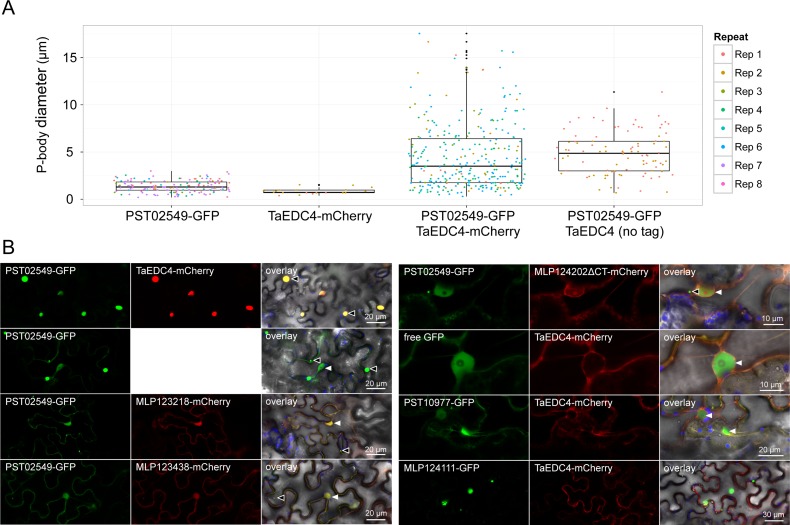
Fig 8. Co-expression of PST02549 and TaEDC4 increases the size of P-bodies.
(A) Categorical scatterplots showing the diameter of P-bodies labelled by PST02549-GFP and/or TaEDC4-mCherry in leaf cells. Boxes depict the interquartile range and the median, vertical bars indicate the first and fourth quartile range, and outlier data points are depicted in black. P-body diameters were measured from laser scanning confocal microscope images acquired through two to eight independent agroinfiltration assays. The different colours correspond to independent observations (repeats). The following numbers of P-bodies were scored: PST02549-GFP (n = 150); TaEDC4-mCherry (n = 20), PST02549-GFP/TaEDC4-mCherry (n = 303), PST02549-GFP/TaEDC4 (n = 96). For treatments 'PST02549-GFP' and 'TaEDC4-mCherry', the fusion proteins were expressed alone or with additional control fusion proteins (see Sheet D in S1 Table for raw data). (B) Live-cell imaging of various GFP and mCherry fusion proteins in N. benthamiana leaf cells. Images present a single optical section of 0.8 μm of a maximal projection of up to 6 optical sections (max. z-stack of 4.8 μm). Overlay images merge GFP, mCherry, chlorophyll, and bright field signals. Note that for the PST02549-GFP/TaEDC4, TaEDC4 was untagged and the mCherry fluorescence signal was not recorded. Proteins were transiently expressed in N. benthamiana leaf cells by agroinfiltration. Live-cell imaging was performed with a laser-scanning confocal microscope with a sequential scanning mode two days after infiltration. GFP and the chlorophyll were excited at 488 nm; the mCherry was excited at 561 nm. GFP (green), mCherry (red), and chlorophyll (blue) fluorescence were collected at 505–525 nm, 580–620 nm and 680–700 nm, respectively. Black arrowheads indicate P-bodies. White arrowheads: nuclei. Note that the large protein aggregates formed by MLP124111-GFP do not show any TaEDC4-mCherry signal.

