Figure 1.
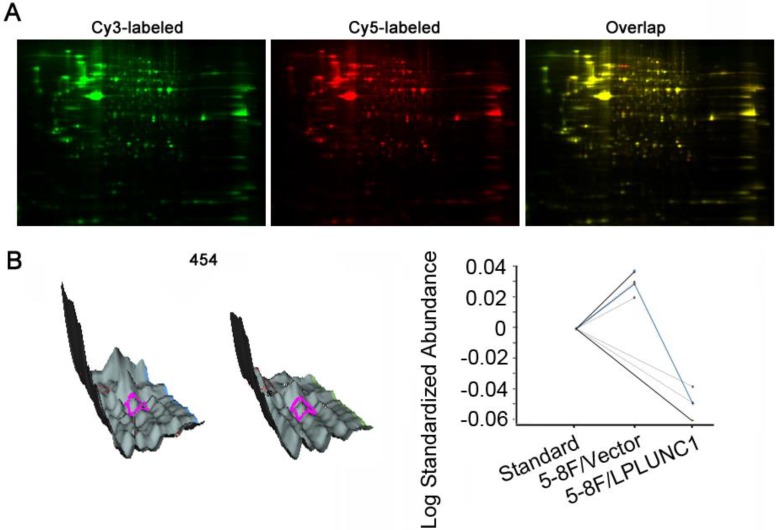
Comparative proteomic analyses of the 5-8F/LPLUNC1 (long palate, lung, nasal epithelium clone 1) and 5-8F/Vector using two-dimensional fluorescence difference gel electrophoresis (2D-DIGE). A) 2D-DIGE gel images, and differential protein spots detected by Decyder software. The pI ranges from 4 to 7 (left to right). B) Spot 454 three-dimensional simulation of protein (top) and its associated graph view (bottom) which indicating the average ratio of expression for spot 454 by using computational analysis with DeCyder 6.5 software.

