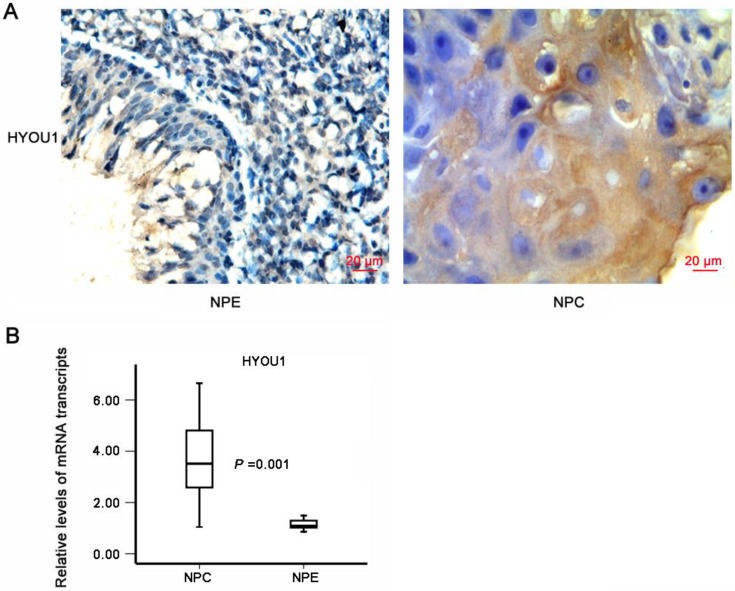
Figure 4.
The expression of HYOU1 in nasopharyngeal carcinoma tissues. A) The expression of HYOU1 in normal tissues and nasopharyngeal carcinoma tissues by IHC detection (magnification×400, scale bars 20 µm). B) qRT-PCR analysis of the relative expression levels of HYOU1 in 36 NPC specimens and 15 NPE specimens; data were normalised according to β-actin. Differences between groups were analysed using the chisquare test (HYOU1: P = 0.001).

