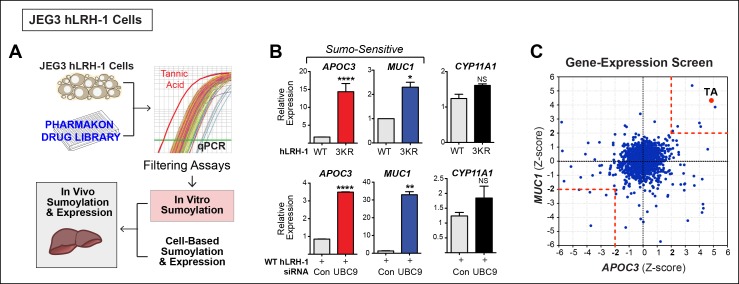
Figure 2. A Phenotypic screen identifies TA as a small-molecule sumoylation modulator.
(A) Schematic outline of the primary screen using JEG3 cells expressing wild-type hLRH-1 and downstream filtering steps to identify small molecules that modulate sumoylation. Individual amplification profiles for MUC1 transcripts are shown for each drug treatment using the Pharmakon 1600 library (upper right panel). Highlighted in red is the amplification curve of MUC1 obtained with TA, the top hit from the primary screen. (B) Relative levels of SUMO-sensitive transcripts APOC3, MUC1 and the SUMO-insensitive transcript CYP11A1 in JEG3 cells expressing wild-type hLRH-1 or SUMO-less hLRH-1 (3KR) (top panel). Relative levels of transcripts as above are shown after 72 hr siControl (Con) or siUBC9 (UBC9) treatment in JEG3 cells expressing hLRH-1. Results represent values obtained for triplicate samples. Statistical significance: ****p<0.0001, **p<0.01, *p<0.05. (C) Scatter plot from the primary screen showing normalized Z-scores for APOC3 and MUC1, calculated as described in ‘Materials and methods’. All compounds yielding Z-scores greater than +2 or less than -2 are shown within red dashed boxes. Positive Z-scores correspond to increased expression of transcripts relative to the control housekeeping gene, TBP. The Z-score obtained for TA is indicated as red dot. TA: Tannic acid.

