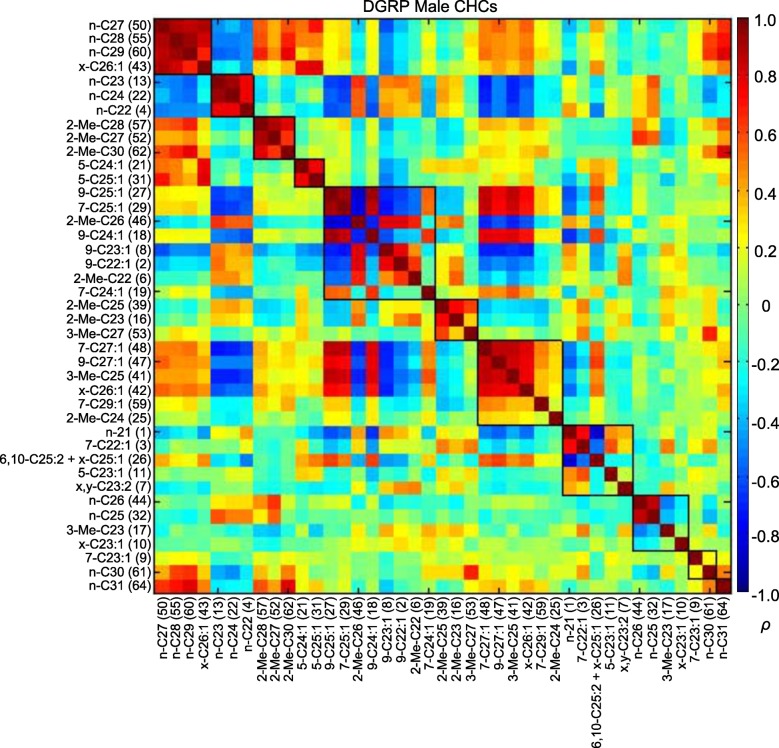
Figure 4. MMC modules of DGRP male CHCs based on Spearman's rank correlation coefficients (ρ).
Correlations are color-coded +1 (dark red) to -1 (dark blue). Correlated CHCs are clustered into groups (modules). Modules (outlined in black) are arranged along the diagonal according to the average strengths of the correlations within the groups; the most strongly and weakly correlated are on the top left and bottom right, respectively.

