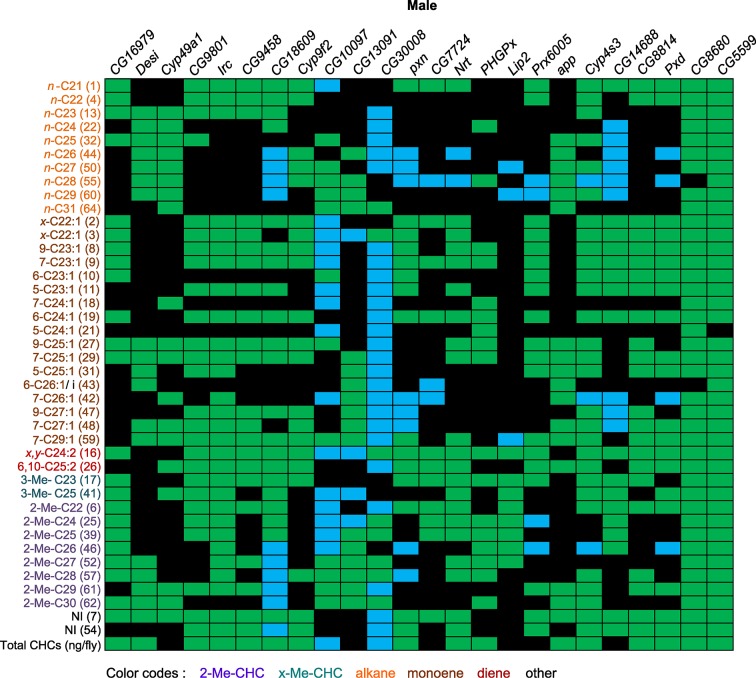
Figure 8. Summary of RNAi and mutant experiments for male CHCs.
UAS-RNAi target gene and the CG10097 e00276 mutant are indicated on the horizontal axis. CHC names and numbers are listed on the y-axis. Data are color coded to represent P-values (P ≤ 0.05) from t-tests for the mean differences of the experimental and the control lines. Black = no significant change; blue = significant decrease; green = significant increase; gray = not applicable (peaks 46 and 57 split into two peaks for the CG10097 mutant).*

